 USD
USD GBP
GBP CNY
CNY EUR
EUR INR
INR JPY
JPY MYR
MYR ZAR
ZAR KRW
KRW THB
THBIndian Touch Technology Market, Forecast to FY 2022
Indian Touch Technology Market, Forecast to FY 2022
Single Touch Capacitive and Surface Acoustic Wave (SAW) are the Most Widely Used Technologies
19-Jan-2018
South Asia, Middle East & North Africa
$4,950.00
Special Price $3,712.50 save 25 %
Description
Touch screens are increasing experiencing high uptake in India market. With the availability of touch panels that can integrate seamlessly with the existing systems, they have caught the imagination of the end-users. Higher penetration of technology in everyday life, rise of Gen-Y, decline in prices, availability of robust technology and rising demand in end-user segments – government, banks, retail, gaming among others are the primary reasons of foreseen growth.
Touch screen market is defined by 5 technologies (Resistive, Single Touch Capacitive, Multi-Touch Capacitive, SAW and Infrared) and screen sizes ranging from sub 15 inches to higher than 100 inches. Touch screens is predominantly an import driven market in India and can be categorized as organized and un-organized market. Organized segment constitutes 41.6% while the un-organized segment constitutes 58.4% of the total market. The un-organized segment comprises imports from China, Taiwan and Korea. Within the organized segment of the market, the Indian touch technology market is relatively consolidated with the top 5 companies accounting for 90% of the organized segment. The most significant market participants in the organized segment are 3M, PQ Labs, Samsung, General Touch Technology and Elo Touch Solutions.
Indian Touch Technology market’s size is INR 259.1 Million in FY17 growing at a CAGR of 15.2% to reach a size of INR 525.3 Million in FY22. Number of units sold are 27,125 in FY17 growing at a CAGR of 18.3% to reach 62,967 in FY22. The market volume is likely to grow at the rate of 25.9% to reach 85,679 in FY22. Similarly, market value if likely to show a growth of 20.6% to reach a size of INR 661.1 Million in FY22. Retail segment will show the highest growth with a CAGR of 19.1%, followed by Banking segment with a CAGR of 14.9%. These two will be followed by Hospitality (14.8%), Railways & Metro (11.5%), Entertainment (11.3%) and Road Transport & Airport (9.9%).
Research Scope
The report describes the touch screen market from all dimensions thereby providing a holistic view enabling informed decisions for the existing and aspiring market participants. It covers the 5 technologies - Resistive, Single Touch Capacitive, Multi-Touch Capacitive, SAW and Infrared. Screen sizes covered are 15 inches and above and end-user segments covered are Banking, Retail, Railways & Metro, Hospitality, Entertainment, Road Transport & Airport and Others.
The fiscal year runs from April to March
Geographic coverage: India
Study period: FY 2017-FY 2022
Base year: FY 20167
Forecast period: FY 2018-FY 2022
Monetary Unit: INR
RESEARCH: INFOGRAPHIC
This infographic presents a brief overview of the research, and highlights the key topics discussed in it.Click image to view it in full size
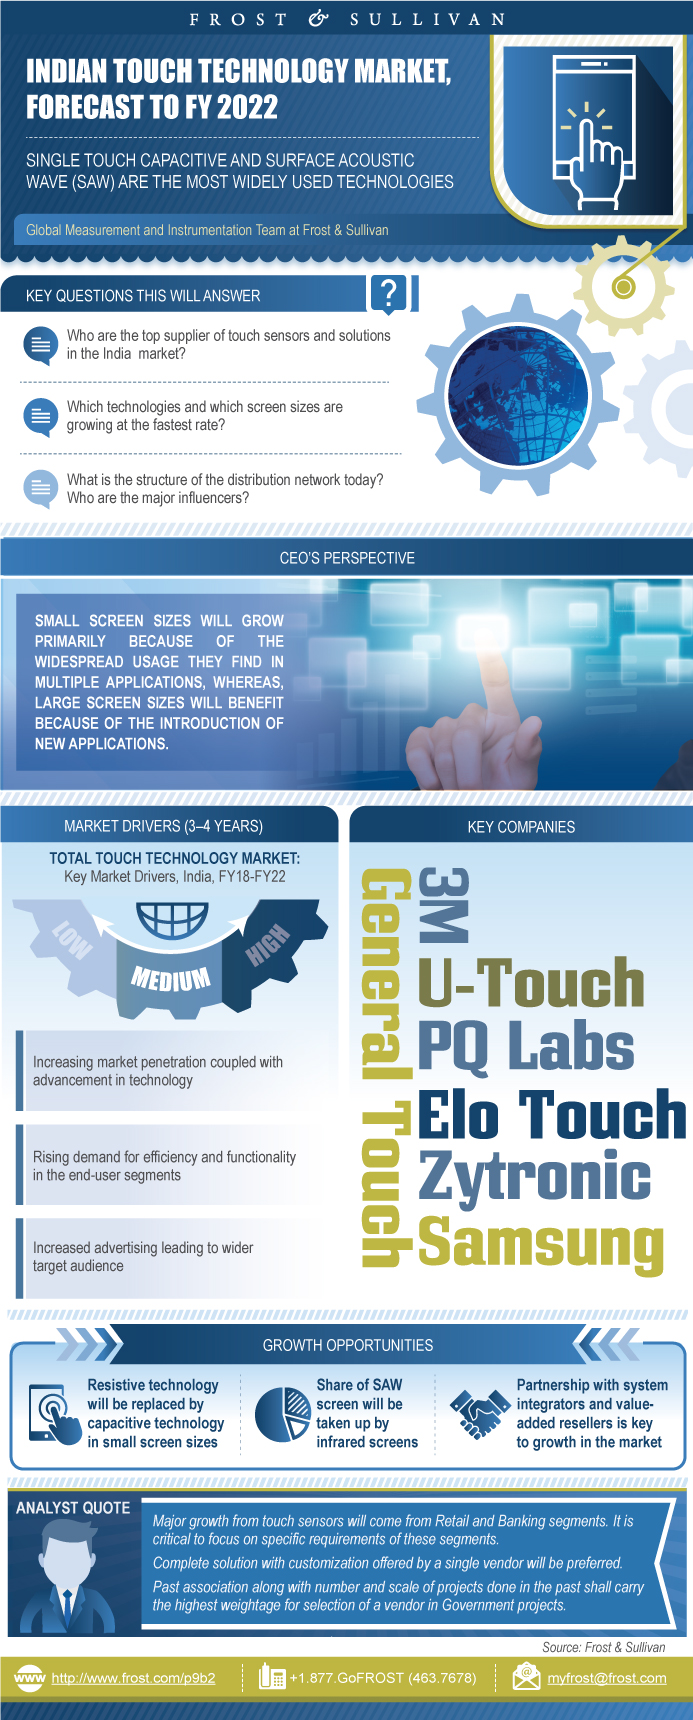
Table of Contents
Key Findings
Revenue Forecast by Technology—Realistic Scenario
Market Engineering Measurements
CEO’s Perspective
Market Definitions
Market Segmentation
Market Distribution Channels
Market Drivers
Market Restraints
Market Engineering Measurements
Unit Shipment and Revenue Forecast
Pricing Trends and Forecast
Volume Forecast by Vertical Market—Realistic Scenario
Revenue Forecast by Vertical Market—Realistic Scenario
Volume Forecast by Vertical Market—Optimistic Scenario
Revenue Forecast by Vertical Market—Optimistic Scenario
Volume Forecast by Screen Size—Realistic Scenario
Revenue Forecast by Screen Size—Realistic Scenario
Volume Forecast by Screen Size—Optimistic Scenario
Revenue Forecast by Screen Size—Optimistic Scenario
Volume Forecast by Technology—Realistic Scenario
Revenue Forecast by Technology—Realistic Scenario
Volume Forecast by Technology—Optimistic Scenario
Revenue Forecast by Technology—Optimistic Scenario
Market Share
Market Share Analysis
Market Share Analysis—Breakup by Technology
Competitive Environment
Top Competitors
Product Highlights
Growth Opportunities and Companies to Action
Growth Opportunity 1—Volume-based Market Expansion
Growth Opportunity 2—Create Differentiation in Large Screen Applications
Growth Opportunity 3—Partnership is Critical to Success
Strategic Imperatives for Success and Growth
India Mega Trends
Key Mega Trends Relevant to Touch Technolog
Mega Trend Impact on the Touch Technology Market
Connectivity and Convergence
Infrastructure Development
Social Trends in India
Bricks and Clicks
Rise of a Manufacturing Economy
Key Findings
Market Engineering Measurements
Unit Shipment and Revenue Forecast—Realistic Scenario
Unit Shipment and Revenue Forecast—Optimistic Scenario
Key Findings
Market Engineering Measurements
Unit Shipment and Revenue Forecast—Realistic Scenario
Unit Shipment and Revenue Forecast—Optimistic Scenario
Key Findings
Market Engineering Measurements
Unit Shipment and Revenue Forecast—Realistic Scenario
Unit Shipment and Revenue Forecast—Optimistic Scenario
Key Findings
Market Engineering Measurements
Unit Shipment and Revenue Forecast—Realistic Scenario
Unit Shipment and Revenue Forecast—Optimistic Scenario
Key Findings
Market Engineering Measurements
Unit Shipment and Revenue Forecast—Realistic Scenario
Unit Shipment and Revenue Forecast—Optimistic Scenario
Market Engineering Measurements
Unit Shipment and Revenue Forecast—Realistic Scenario
Unit Shipment and Revenue Forecast—Optimistic Scenario
The Last Word—3 Big Predictions
Legal Disclaimer
Market Engineering Methodology
List of Companies in “Others”
Partial List of Companies Interviewed
Definitions
- 1. Total Touch Technology Market: Key Market Drivers, India, FY18-FY22
- 2. Total Touch Technology Market: Key Market Restraints, India, FY18-FY22
- 3. Total Touch Technology Market: Market Engineering Measurements, India, FY17
- 4. Total Touch Technology Market: Company Market Share Analysis of Top 7 Participants, India, FY17
- 5. Total Touch Technology Market: Technology wise Market Share, India, FY17
- 6. Total Touch Technology Market: Competitive Structure, India, FY17
- 7. Total Touch Technology Market: SWOT Analysis, India, FY17
- 8. Total Touch Technology Market: Top Company Product Highlights, India, FY17
- 9. Potential in Key Mobile-based Industries, India, 2020
- 10. Cumulative Infrastructure Planned Outlay by Segment, India, 2013–2017
- 11. Banking Segment: Market Engineering Measurements, India, FY17
- 12. Retail Segment: Market Engineering Measurements, India, FY17
- 13. Railways and Metro Segment: Market Engineering Measurements, India, FY17
- 14. Hospitality Segment: Market Engineering Measurements, India, FY17
- 15. Entertainment Segment: Market Engineering Measurements, India, FY17
- 16. Road Transport and Airport Segment: Market Engineering Measurements, India, FY17
- 1. Total Touch Technology Market: Revenue Forecast by Technology, India, FY14–FY22
- 2. Total Touch Technology Market: Market Engineering Measurements, India, FY17
- 3. Total Touch Technology Market: Percent Volume Breakdown by End-user Segment, India, FY17
- 4. Total Touch Technology Market: Percent Revenue Breakdown by End-user Segment, India, FY17
- 5. "Total Touch Technology Market: Percent Volume Breakdown by Screen Size, India, FY17"
- 6. "Total Touch Technology Market: Percent Revenue Breakdown by Screen Size, India, FY17"
- 7. Total Touch Technology Market: Percent Volume Breakdown by Technology, India, FY17
- 8. Total Touch Technology Market: Percent Revenue Breakdown by Technology, India, FY17
- 9. Total Touch Technology Market: Distribution Channel Analysis, India, FY17
- 10. Total Touch Technology Market: Unit Shipment and Revenue Forecast, India, FY14–FY22
- 11. Total Touch Technology Market: Average Price for Touch Technology, India, FY14-FY22
- 12. Total Touch Technology Market: Volume Forecast by Vertical Market, India, FY14–FY22
- 13. Total Touch Technology Market: Revenue Forecast by Vertical Market, India, FY14–FY22
- 14. Total Touch Technology Market: Volume Forecast by Vertical Market, India, FY14–FY22
- 15. Total Touch Technology Market: Revenue Forecast by Vertical Market, India, FY14–FY22
- 16. Total Touch Technology Market: Volume Forecast by Screen Size, India, FY14–FY22
- 17. Total Touch Technology Market: Revenue Forecast by Screen Size, India, FY14–FY22
- 18. Total Touch Technology Market: Volume Forecast by Screen Size, India, FY14–FY22
- 19. Total Touch Technology Market: Revenue Forecast by Screen Size, India, FY14–FY22
- 20. Total Touch Technology Market: Volume Forecast by Technology, India, FY14–FY22
- 21. Total Touch Technology Market: Revenue Forecast by Technology, India, FY14–FY22
- 22. Total Touch Technology Market: Volume Forecast by Technology, India, FY14–FY22
- 23. Total Touch Technology Market: Revenue Forecast by Technology, India, FY14–FY22
- 24. Total Touch Technology Market: Percent Revenue Forecast by Distribution Channel, India, FY14–FY22
- 25. Total Touch Technology Market: Percent Revenue Breakdown, India, 2016
- 26. Total Touch Technology Market: Organized vs Unorganized Market Share, India, FY17
- 27. Infrastructure Planned Outlay, India, 2013–2017
- 28. Retailing Formats, India, 2015–2025
- 29. Nominal GDP, India, 2011–2020
- 30. Manufacturing Contribution to GDP, India, 2015–2022
- 31. Banking Segment: Unit Shipment and Revenue Forecast, India, FY14–FY22
- 32. Banking Segment: Unit Shipment and Revenue Forecast, India, FY14–FY22
- 33. Retail Segment: Unit Shipment and Revenue Forecast, India, FY14–FY22
- 34. Retail Segment: Unit Shipment and Revenue Forecast, India, FY14–FY22
- 35. Railways and Metro Segment: Unit Shipment and Revenue Forecast, India, FY14–FY22
- 36. Railways and Metro Segment: Unit Shipment and Revenue Forecast, India, FY14–FY22
- 37. Hospitality Segment: Unit Shipment and Revenue Forecast, India, FY14–FY22
- 38. Hospitality Segment: Unit Shipment and Revenue Forecast, India, FY14–FY22
- 39. Entertainment Segment: Unit Shipment and Revenue Forecast, India, FY14–FY22
- 40. Entertainment Segment: Unit Shipment and Revenue Forecast, India, FY14–FY22
- 41. Road Transport and Airport Segment: Unit Shipment and Revenue Forecast, India, FY14–FY22
- 42. Road Transport and Airport Segment: Unit Shipment and Revenue Forecast, India, FY14–FY22
Popular Topics
Research Sco
| No Index | No |
|---|---|
| Podcast | No |
| Table of Contents | | Executive Summary~ || Key Findings~ || Revenue Forecast by Technology—Realistic Scenario~ || Market Engineering Measurements~ || CEO’s Perspective~ | Market Overview~ || Market Definitions~ || Market Segmentation~ || Market Distribution Channels~ | Drivers and Restraints—Total Touch Technology Market~ || Market Drivers~ || Market Restraints~ | Forecasts and Trends—Total Touch Technology Market~ || Market Engineering Measurements~ || Unit Shipment and Revenue Forecast~ || Pricing Trends and Forecast~ || Volume Forecast by Vertical Market—Realistic Scenario~ || Revenue Forecast by Vertical Market—Realistic Scenario~ || Volume Forecast by Vertical Market—Optimistic Scenario~ || Revenue Forecast by Vertical Market—Optimistic Scenario~ || Volume Forecast by Screen Size—Realistic Scenario~ || Revenue Forecast by Screen Size—Realistic Scenario~ || Volume Forecast by Screen Size—Optimistic Scenario~ || Revenue Forecast by Screen Size—Optimistic Scenario~ || Volume Forecast by Technology—Realistic Scenario~ || Revenue Forecast by Technology—Realistic Scenario~ || Volume Forecast by Technology—Optimistic Scenario~ || Revenue Forecast by Technology—Optimistic Scenario~ | Market Share and Competitive Analysis—Total Touch Technology Market~ || Market Share~ || Market Share Analysis~ || Market Share Analysis—Breakup by Technology~ || Competitive Environment~ || Top Competitors~ || Product Highlights~ | Competitive Factors and Assessment~ || Growth Opportunities and Companies to Action~ || Growth Opportunity 1—Volume-based Market Expansion~ || Growth Opportunity 2—Create Differentiation in Large Screen Applications~ || Growth Opportunity 3—Partnership is Critical to Success~ || Strategic Imperatives for Success and Growth ~ | Mega Trends and Industry Convergence Implications~ || India Mega Trends~ || Key Mega Trends Relevant to Touch Technolog~ || Mega Trend Impact on the Touch Technology Market~ || Connectivity and Convergence~ || Infrastructure Development~ || Social Trends in India~ || Bricks and Clicks~ || Rise of a Manufacturing Economy~ | Banking Segment Analysis~ || Key Findings~ || Market Engineering Measurements~ || Unit Shipment and Revenue Forecast—Realistic Scenario~ || Unit Shipment and Revenue Forecast—Optimistic Scenario~ | Retail Segment Analysis~ || Key Findings~ || Market Engineering Measurements~ || Unit Shipment and Revenue Forecast—Realistic Scenario~ || Unit Shipment and Revenue Forecast—Optimistic Scenario~ | Railways and Metro Segment Analysis~ || Key Findings~ || Market Engineering Measurements~ || Unit Shipment and Revenue Forecast—Realistic Scenario~ || Unit Shipment and Revenue Forecast—Optimistic Scenario~ | Hospitality Segment Analysis~ || Key Findings~ || Market Engineering Measurements~ || Unit Shipment and Revenue Forecast—Realistic Scenario~ || Unit Shipment and Revenue Forecast—Optimistic Scenario~ | Entertainment Segment Analysis~ || Key Findings~ || Market Engineering Measurements~ || Unit Shipment and Revenue Forecast—Realistic Scenario~ || Unit Shipment and Revenue Forecast—Optimistic Scenario~ | Road Transport and Airport Segment Analysis~ | Key Findings~ || Market Engineering Measurements~ || Unit Shipment and Revenue Forecast—Realistic Scenario~ || Unit Shipment and Revenue Forecast—Optimistic Scenario~ | The Last Word~ || The Last Word—3 Big Predictions~ || Legal Disclaimer~ | Appendix~ || Market Engineering Methodology~ || List of Companies in “Others”~ || Partial List of Companies Interviewed~ || Definitions~ |
| List of Charts and Figures | 1. Total Touch Technology Market: Key Market Drivers, India, FY18-FY22~ 2. Total Touch Technology Market: Key Market Restraints, India, FY18-FY22~ 3. Total Touch Technology Market: Market Engineering Measurements, India, FY17~ 4. Total Touch Technology Market: Company Market Share Analysis of Top 7 Participants, India, FY17~ 5. Total Touch Technology Market: Technology wise Market Share, India, FY17~ 6. Total Touch Technology Market: Competitive Structure, India, FY17~ 7. Total Touch Technology Market: SWOT Analysis, India, FY17~ 8. Total Touch Technology Market: Top Company Product Highlights, India, FY17~ 9. Potential in Key Mobile-based Industries, India, 2020~ 10. Cumulative Infrastructure Planned Outlay by Segment, India, 2013–2017~ 11. Banking Segment: Market Engineering Measurements, India, FY17~ 12. Retail Segment: Market Engineering Measurements, India, FY17~ 13. Railways and Metro Segment: Market Engineering Measurements, India, FY17~ 14. Hospitality Segment: Market Engineering Measurements, India, FY17~ 15. Entertainment Segment: Market Engineering Measurements, India, FY17~ 16. Road Transport and Airport Segment: Market Engineering Measurements, India, FY17~| 1. Total Touch Technology Market: Revenue Forecast by Technology, India, FY14–FY22~ 2. Total Touch Technology Market: Market Engineering Measurements, India, FY17~ 3. Total Touch Technology Market: Percent Volume Breakdown by End-user Segment, India, FY17~ 4. Total Touch Technology Market: Percent Revenue Breakdown by End-user Segment, India, FY17~ 5. "Total Touch Technology Market: Percent Volume Breakdown by Screen Size, India, FY17"~ 6. "Total Touch Technology Market: Percent Revenue Breakdown by Screen Size, India, FY17"~ 7. Total Touch Technology Market: Percent Volume Breakdown by Technology, India, FY17~ 8. Total Touch Technology Market: Percent Revenue Breakdown by Technology, India, FY17~ 9. Total Touch Technology Market: Distribution Channel Analysis, India, FY17~ 10. Total Touch Technology Market: Unit Shipment and Revenue Forecast, India, FY14–FY22~ 11. Total Touch Technology Market: Average Price for Touch Technology, India, FY14-FY22~ 12. Total Touch Technology Market: Volume Forecast by Vertical Market, India, FY14–FY22~ 13. Total Touch Technology Market: Revenue Forecast by Vertical Market, India, FY14–FY22~ 14. Total Touch Technology Market: Volume Forecast by Vertical Market, India, FY14–FY22~ 15. Total Touch Technology Market: Revenue Forecast by Vertical Market, India, FY14–FY22~ 16. Total Touch Technology Market: Volume Forecast by Screen Size, India, FY14–FY22~ 17. Total Touch Technology Market: Revenue Forecast by Screen Size, India, FY14–FY22~ 18. Total Touch Technology Market: Volume Forecast by Screen Size, India, FY14–FY22~ 19. Total Touch Technology Market: Revenue Forecast by Screen Size, India, FY14–FY22~ 20. Total Touch Technology Market: Volume Forecast by Technology, India, FY14–FY22~ 21. Total Touch Technology Market: Revenue Forecast by Technology, India, FY14–FY22~ 22. Total Touch Technology Market: Volume Forecast by Technology, India, FY14–FY22~ 23. Total Touch Technology Market: Revenue Forecast by Technology, India, FY14–FY22~ 24. Total Touch Technology Market: Percent Revenue Forecast by Distribution Channel, India, FY14–FY22~ 25. Total Touch Technology Market: Percent Revenue Breakdown, India, 2016~ 26. Total Touch Technology Market: Organized vs Unorganized Market Share, India, FY17~ 27. Infrastructure Planned Outlay, India, 2013–2017 ~ 28. Retailing Formats, India, 2015–2025~ 29. Nominal GDP, India, 2011–2020~ 30. Manufacturing Contribution to GDP, India, 2015–2022~ 31. Banking Segment: Unit Shipment and Revenue Forecast, India, FY14–FY22~ 32. Banking Segment: Unit Shipment and Revenue Forecast, India, FY14–FY22~ 33. Retail Segment: Unit Shipment and Revenue Forecast, India, FY14–FY22~ 34. Retail Segment: Unit Shipment and Revenue Forecast, India, FY14–FY22~ 35. Railways and Metro Segment: Unit Shipment and Revenue Forecast, India, FY14–FY22~ 36. Railways and Metro Segment: Unit Shipment and Revenue Forecast, India, FY14–FY22~ 37. Hospitality Segment: Unit Shipment and Revenue Forecast, India, FY14–FY22~ 38. Hospitality Segment: Unit Shipment and Revenue Forecast, India, FY14–FY22~ 39. Entertainment Segment: Unit Shipment and Revenue Forecast, India, FY14–FY22~ 40. Entertainment Segment: Unit Shipment and Revenue Forecast, India, FY14–FY22~ 41. Road Transport and Airport Segment: Unit Shipment and Revenue Forecast, India, FY14–FY22~ 42. Road Transport and Airport Segment: Unit Shipment and Revenue Forecast, India, FY14–FY22~ |
| Author | Manu Tiwari |
| Industries | Electronics and Sensors |
| WIP Number | P9B2-01-00-00-00 |
| Is Prebook | No |