 USD
USD GBP
GBP CNY
CNY EUR
EUR INR
INR JPY
JPY MYR
MYR ZAR
ZAR KRW
KRW THB
THBGlobal Demand Response Market, Forecast to 2024
Global Demand Response Market, Forecast to 2024
Curtailing Power Consumption Through Incentive and Behavioral Based Programs
06-Jun-2018
North America
Description
Demand and response programs are expected to change consumer behavior and general attitudes toward power consumption through providing monetary rewards for power reduction. DR transforms the centralized one-way traditional energy traffic flow from the power plants to energy-consuming units. DR programs, through intelligent and balanced energy management routines, create a two-way energy traffic flow, balancing energy demand with available supply, thereby enabling a highly interactive and more energy-efficient market.
Managing energy use through DR programs has been in existence in one form or the other over the last two decades. Monetary incentives and cost-savings options by curtailing power consumption during peak demand period has been available for commercial and industrial C&I) customers since the early millennium.
One of the key hurdles for the widespread adoption of DR is the lack of customer engagement and support, with the challenge being a lack of control of electrical devices during times of peak demand. A majority of customers in many regions, especially Europe, are accustomed to uniform electricity prices, and therefore awareness about the volatile cost of electricity is limiting the uptake of DR programs. Utilities expect to save millions by reducing investments on peak-generation plants to support electricity demand. Commercial and industrial (C&I) sectors have been compliant on this front for years, using it as an avenue to reduce operating cost generated from power-dense manufacturing and IT equipment.
Key Features
The key objective of this research study is to analyze and understand the global demand response market. Drivers and restraints, competitive analysis, market trends, growth opportunities, and geographical trends, and revenue forecast for the period covering 2014 to 2024 are discussed. The revenue estimation represents only the curtailment services offered by DR aggregators and the hardware and software component of the DR solution provided by both aggregators and independent solution providers or third-party vendors through partnerships with utilities and does not include smart meters and external communication devices. Major end-user segmentation includes C&I and residential. The geographical scope of the study includes North America, European Union, Asia-Pacific, and Rest of the World.
Key Issues Addressed
- What are the key drivers and restraints for the DR market globally?
- What are the trends in technology and business models used in the global DR market?
- What is the current size of the global DR market and what are the forecasts to 2024?
- What is the competitive landscape in the DR market?
- How is the market segmented by end-users?
- What are the key growth opportunities for DR service providers globally?
RESEARCH: INFOGRAPHIC
This infographic presents a brief overview of the research, and highlights the key topics discussed in it.Click image to view it in full size
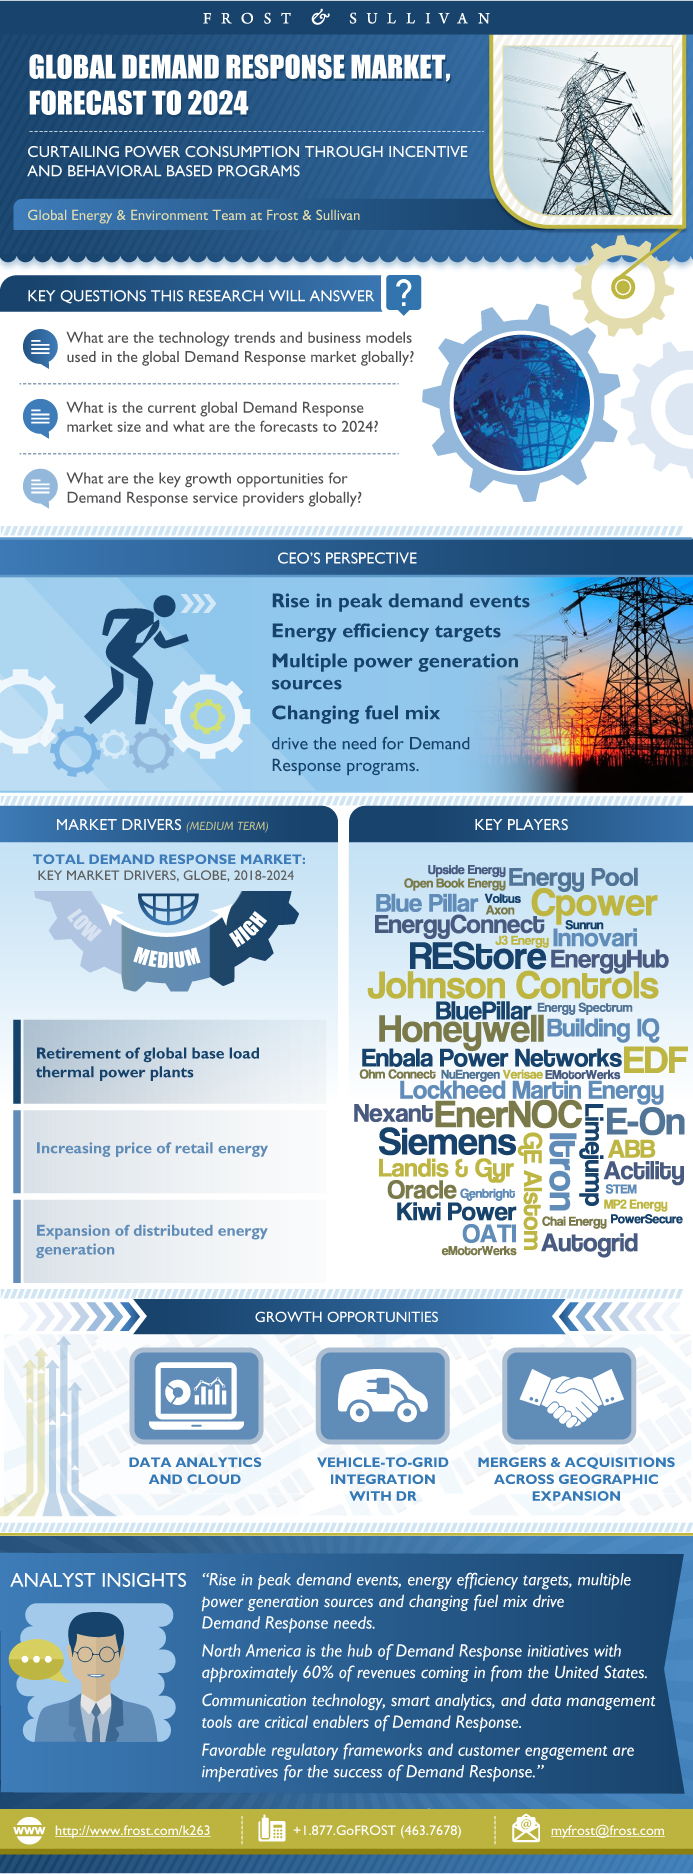
Table of Contents
Executive Summary—Key Findings
Market Engineering Measurements
CEO’s Perspective
Market Definition
Market Definition—Classification of DR
Market Definition—Demand Response Participation
Market Definition—Customer Segmentation
Market Overview
Market Overview—Geographic Scope
Market Drivers
Market Restraints
Market Engineering Measurements
Revenue Forecast
Percent Revenue Forecast by Region
Revenue Forecast by Region
Revenue Forecast—Residential Customers
Revenue Forecast—Commercial & Industrial Customers
Market Share
Competitive Environment
Competitive Factors and Assessment
REStore
EnerNOC (Enel)
Itron
Growth Opportunity 1—Blockchain-based DR Programs
Growth Opportunity 2—Data Analytics and Cloud
Growth Opportunity 3—Vehicle-to-Grid Integration with DR
Growth Opportunity 4—Geographic Expansion
Strategic Imperatives for Success and Growth
The Last Word—3 Big Predictions
Legal Disclaimer
Market Engineering Methodology
Partial List of Interviewed Companies and Other Companies
List of Exhibits
- 1. Total Demand Response Market: Key Market Drivers, Global, 2018–2024
- 2. Total Demand Response Market: Key Market Restraints, Global, 2018–2024
- 3. Total Demand Response Market: Market Engineering Measurements, Global, 2017
- 4. Total Demand Response Market: Revenue Forecast by Region, Global, 2014–2024
- 5. Total Demand Response Market: Competitive Structure, Global, 2017
- 1. Total Demand Response Market: Revenue Forecast, Global, 2017–2024
- 2. Total Demand Response Market: Key Market Drivers and Restraints, Global, 2018–2024
- 3. Total Demand Response Market: Percent Revenue Forecast by Customer Segmentation, Global, 2017 and 2024
- 4. Total Demand Response Market: Percent Revenue Forecast by Region, Global, 2017–2024
- 5. Total Demand Response Market: Key Aggregators and Software Vendors, Global, 2017
- 6. Total Demand Response Market: Market Engineering Measurements, Global, 2017
- 7. Total Demand Response Market: Percent Revenue by Customer Segment, Global, 2017
- 8. Total Coal Plant Retirements, Global, 2012–2017
- 9. EV Vehicle in Operation, Global, 2017–2024
- 10. Total Demand Response Market: Revenue Forecast, Global, 2014–2024
- 11. Total Demand Response Market: Percent Revenue Forecast by Region, Global, 2014–2024
- 12. DR Residential Segment: Revenue Forecast, Global, 2014–2024
- 13. DR Commercial & Industrial Segment: Revenue Forecast, Global, 2014–2024
- 14. Total Demand Response Market: Tiers of Competition, Global, 2017
Popular Topics
Key Features
The key objective of this research study is to analyze and understand the global demand response market. Drivers and restraints, competitive analysis, market trends, growth opportunities, and geographical trends, and revenue forecast for the period covering 2014 to 2024 are discussed. The revenue estimation represents only the curtailment services offered by DR aggregators and the hardware and s
| No Index | No |
|---|---|
| Podcast | No |
| Table of Contents | | Executive Summary~ || Executive Summary—Key Findings~ || Market Engineering Measurements~ || CEO’s Perspective~ | Market Overview~ || Market Definition~ || Market Definition—Classification of DR~ || Market Definition—Demand Response Participation~ || Market Definition—Customer Segmentation~ || Market Overview~ || Market Overview—Geographic Scope~ | Drivers and Restraints—Total Demand Response Market~ || Market Drivers~ || Market Restraints~ | Forecasts and Trends—Total Demand Response Market~ || Market Engineering Measurements~ || Revenue Forecast~ || Percent Revenue Forecast by Region~ || Revenue Forecast by Region~ | End User Analysis—Total Demand Response Market~ || Revenue Forecast—Residential Customers~ || Revenue Forecast—Commercial & Industrial Customers~ | Market Share and Competitive Analysis—Total Demand Response Market~ || Market Share~ || Competitive Environment~ || Competitive Factors and Assessment~ || REStore~ || EnerNOC (Enel)~ || Itron~ | Growth Opportunities and Companies to Action~ || Growth Opportunity 1—Blockchain-based DR Programs~ || Growth Opportunity 2—Data Analytics and Cloud~ || Growth Opportunity 3—Vehicle-to-Grid Integration with DR~ || Growth Opportunity 4—Geographic Expansion~ || Strategic Imperatives for Success and Growth~ | The Last Word~ || The Last Word—3 Big Predictions~ || Legal Disclaimer~ | Appendix~ || Market Engineering Methodology~ || Partial List of Interviewed Companies and Other Companies~ || List of Exhibits~ |
| List of Charts and Figures | 1. Total Demand Response Market: Key Market Drivers, Global, 2018–2024~ 2. Total Demand Response Market: Key Market Restraints, Global, 2018–2024~ 3. Total Demand Response Market: Market Engineering Measurements, Global, 2017~ 4. Total Demand Response Market: Revenue Forecast by Region, Global, 2014–2024~ 5. Total Demand Response Market: Competitive Structure, Global, 2017~| 1. Total Demand Response Market: Revenue Forecast, Global, 2017–2024~ 2. Total Demand Response Market: Key Market Drivers and Restraints, Global, 2018–2024~ 3. Total Demand Response Market: Percent Revenue Forecast by Customer Segmentation, Global, 2017 and 2024~ 4. Total Demand Response Market: Percent Revenue Forecast by Region, Global, 2017–2024~ 5. Total Demand Response Market: Key Aggregators and Software Vendors, Global, 2017~ 6. Total Demand Response Market: Market Engineering Measurements, Global, 2017~ 7. Total Demand Response Market: Percent Revenue by Customer Segment, Global, 2017~ 8. Total Coal Plant Retirements, Global, 2012–2017~ 9. EV Vehicle in Operation, Global, 2017–2024~ 10. Total Demand Response Market: Revenue Forecast, Global, 2014–2024~ 11. Total Demand Response Market: Percent Revenue Forecast by Region, Global, 2014–2024~ 12. DR Residential Segment: Revenue Forecast, Global, 2014–2024~ 13. DR Commercial & Industrial Segment: Revenue Forecast, Global, 2014–2024~ 14. Total Demand Response Market: Tiers of Competition, Global, 2017~ |
| Author | Naren Pasupalati |
| Industries | Energy |
| WIP Number | K263-01-00-00-00 |
| Keyword 1 | Demand Response |
| Is Prebook | No |
| GPS Codes | 9852 |