 USD
USD GBP
GBP CNY
CNY EUR
EUR INR
INR JPY
JPY MYR
MYR ZAR
ZAR KRW
KRW THB
THBGlobal Modular Data Center Market, Forecast to 2020
Global Modular Data Center Market, Forecast to 2020
Emerging Market Crests to High Growth Future with Multiple Feature and Functionality Benefits
11-May-2016
Global
$4,950.00
Special Price $3,712.50 save 25 %
Description
The global modular data center market is expected to grow at a strong pace till 2020. North America and Europe accounted for 70% of the total market revenues in 2015, while Asia-Pacific will be the fastest growing region during the forecast period. The IT and telecom end-user verticals accounted for a little over half of the total market revenues, while the disaster recovery application type was the biggest revenue contributor in 2015. Even with multiple market-related drivers such as high growth in collocation and cloud, increasing demand for data storage, overall increase in global data centre investments, and a boom in Internet of things (IoT) and Big Data, the most compelling driver is the design aspect of the modular data centre.
RESEARCH: INFOGRAPHIC
This infographic presents a brief overview of the research, and highlights the key topics discussed in it.Click image to view it in full size
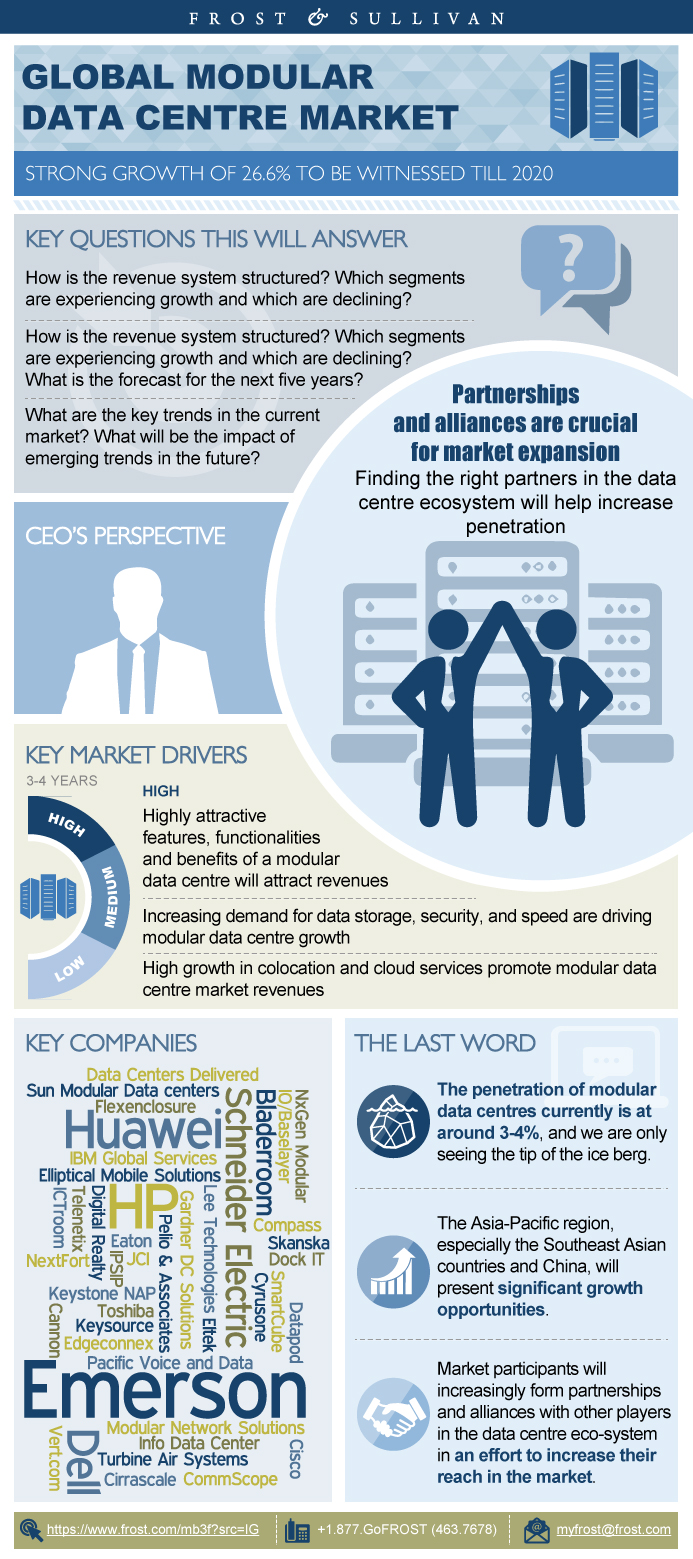
Table of Contents
Key Findings—Modular Data Centre Market
Market measurements
- By Market
- By Competitor
- By Total Addressable Market
- By Industry Advancements
CEO’s Perspective
Trends Driving the Future of Data Centres, 2015–2020
Scope - Modular Data Centre’s
Market Definitions
Market Segmentations
Drivers, 2016–2020
Restraints, 2016–2020
Market measurements, 2015
Market Share
Market Measurements, 2015
Market Trends
Revenue Forecasts, 2013–2020
Market Measurements, 2015
Market Trends
Revenue Forecasts, 2013–2020
Market Measurements, 2015
Market Trends
Revenue Forecast, 2013–2020
Market Measurements, 2015
Market trends
Revenue Forecast, 2013–2020
3 Big Predictions
Disclaimer
Market Methodology
Partial List of Other Companies
- 1. Total Modular Data Centre Market: Market Engineering Measurements, Global, 2015
- 2. Total Data Modular Centre Market: Data Centre of Tomorrow, Global, 2015–2020
- 3. Total Modular Data Centre Market: Percent Sales Breakdown by End-user Vertical, Global, 2015
- 4. Total Modular Data Centre Market: Percent Revenue Breakdown by Application Type, Global, 2015
- 5. Total Modular Data Centre Market: Percent Sales Breakdown by Region, Global, 2015
- 6. Total Modular Data Centre Market: Key Market Drivers, Global, 2016–2020
- 7. Total Modular Data Centre Market: Key Advantages/Benefits of a Modular Data Centre, Global, 2015
- 8. Total IP Traffic: Global, 2014–2020
- 9. Percent Split of IP Traffic—Fixed Internet vs. Managed IP vs. Mobile Data: Global, 2014–2020
- 10. Total Data Centre Traffic Growth Forecast: Global, 2014–2020
- 11. Total Traditional (Non-cloud) Data Centre Traffic Growth Forecast: Global, 2014–2020
- 12. Data Centre Market: Year-over-year (YOY) Outsourced Footprint Growth Rate, Global, 2014
- 13. Data Centre Market: White Space Growth—Outsourced Data Centre vs. In-house, Global, 2010, 2013, and 2015
- 14. Data Centre Market: YOY Total Facilities Growth Rate, Global, 2014
- 15. Total Data Centre Workload: Global, 2014–2020
- 16. Percent Split of Data Centre Workload—Traditional vs. Cloud: Global, 2014–2020
- 17. Cloud Data Centre Traffic—CAGR by Region: Global, 2014–2019
- 18. Cloud Data Centre Traffic Growth Forecast: Global, 2014–2020
- 19. Percent of Data Centre Traffic—Cloud vs. Traditional: Global, 2014–2020
- 20. Unprecedented growth in IoT and Big Data will play a crucial role in modular data centre market expansion.
- 21. Global Drivers of IoT
- 22. Big Data Analytics Market: Revenue Forecast, Global, 2015–2022
- 23. Big Data Analytics Market: Life Cycle Stage by Region, Global, 2015
- 24. Percent of Connected Devices by Segment: Global, 2014, 2017, and 2020
- 25. Data Centre Market: Investment Forecast, Global, 2012–2016
- 26. Data Centre Market: Investment Forecast by Type, Global, 2012 and 2016
- 27. Data Centre Market: Investment Growth Rate Forecast by Investment Type, Global, 2015 and 2016
- 28. Regional Investment Highlights—Snapshot
- 29. Total Modular Data Centre Market: Key Market Restraints, Global, 2016–2020
- 30. End-user Confidence in Modular Data Centre Technology: Global, 2015
- 31. Modular Data Centre Market: End-user Concerns Limiting Adoption, Global 2015
- 32. Total Modular Data Centre Market: Market Engineering Measurements, Global, 2015
- 33. Total Modular Data Centre Market: Revenue Forecast, Global, 2013–2020
- 34. Total Modular Data Centre Market: Percent Revenue Forecast by Region, Global, 2013–2020
- 35. Total Modular Data Centre Market: Regional Attractiveness, Global, 2015
- 36. Total Modular Data Centre Market: Revenue Forecast by Region, Global, 2013–2020
- 37. Total Modular Data Centre Market: Percent Revenue Forecast by End-user Vertical, Global, 2013–2020
- 38. Total Modular Data Centre Market: Segment Attractiveness by End-user Vertical, Global, 2015
- 39. Total Modular Data Centre Market: Revenue Forecast by End-user Vertical, Global, 2013–2020
- 40. Total Modular Data Centre Market: Percent Revenue Forecast by Application Type, Global, 2013–2020
- 41. Total Modular Data Centre Market: Segment Attractiveness by Application Type, Global, 2015
- 42. Total Modular Data Centre Market: Revenue Forecast by Application Type, Global, 2013–2020
- 43. IaaS Market: Revenue Forecast, US, 2013–2020
- 44. IaaS Market: Revenue Forecast, Europe, 2013–2020
- 45. Regional Internet Penetration—Fixed Line Internet vs. Mobile Internet: Global, 2014
- 46. Regional Internet Penetration—Fixed Line Internet vs. Mobile Internet: Global, 2019
- 47. Average Latency by Region: Global, 2015
- 48. Total Modular Data Centre Market: Percent Cost Split by Module Type, Global, 2015
- 49. Total Modular Data Centre Market: Percent Cost Split by Module Type, Global, 2020
- 50. Total Modular Data Centre Market: Cost Split by Module Type, Global, 2015
- 51. Total Modular Data Centre Market: Cost Split by Module Type, Global, 2020
- 52. Total Modular Data Centre Market: Percent Revenue Breakdown, Global, 2015
- 53. Total Modular Data Centre Market: Company Market Share Analysis of Top 5 Participants, Global, 2015
- 54. Modular Data Centre Market—Top 3 Companies by Region
- 55. Total Modular Data Centre Market: Competitive Structure, Global, 2015
- 56. Modular Data Centre Market: Market Engineering Measurements, North America, 2015
- 57. Data Traffic–Consumer Internet Video: North America, 2014–2019
- 58. Data Traffic–Mobile Data/Internet: North America, 2014–2019
- 59. Workload Distribution–Cloud Data Centres vs. Traditional Data Centres: North America, 2014–2019
- 60. Workload Distribution Growth Rate–Cloud Data Centres vs. Traditional Data Centres: North America, 2014–2019
- 61. Modular Data Centre Market: Revenue Forecast, North America, 2013–2020
- 62. Total Modular Data Centre Market: Percent Revenue Breakdown, Global, 2015
- 63. Modular Data Centre Market: Percent Revenue Forecast by End-user Vertical, North America, 2013–2020
- 64. Modular Data Centre Market: Revenue Forecast by End-user Vertical Segment, North America, 2013–2020
- 65. Modular Data Centre Market: Percent Revenue Forecast by Application Type, North America, 2013–2020
- 66. Modular Data Centre Market: Revenue Forecast by Application Type, North America, 2013–2020
- 67. Average Latency: North America, 2015
- 68. Modular Data Centre Market: Percent Cost Split by Module Type, North America, 2015
- 69. Modular Data Centre Market: Percent Cost Split by Module Type, North America, 2020
- 70. Modular Data Centre Market: Cost Split by Module Type, North America, 2015
- 71. Modular Data Centre Market: Cost Split by Module Type, North America, 2020
- 72. Modular Data Centre Market: Market Engineering Measurements, Europe, 2015
- 73. Data Traffic–Consumer Internet Video: Europe, 2014–2019
- 74. Data Traffic–Mobile Data/Internet: Europe, 2014–2019
- 75. Workload Distribution–Cloud Data Centres vs. Traditional Data Centres: Western Europe, 2014—2019
- 76. Workload Distribution Growth Rate–Cloud Data Centres vs. Traditional Data Centres: Western Europe, 2014–2019
- 77. Workload Distribution–Cloud Data Centres vs. Traditional Data Centres: CEE, 2014–2019
- 78. Workload Distribution Growth Rate–Cloud Data Centres vs. Traditional Data Centres: CEE, 2014–2019
- 79. Modular Data Centre Market: Revenue Forecast, Europe, 2013–2020
- 80. Total Modular Data Centre Market: Percent Revenue Breakdown, Global, 2015
- 81. Modular Data Centre Market: Percent Revenue Forecast by End-user Vertical, Europe, 2013–2020
- 82. Modular Data Centre Market: Revenue Forecast by End-user Vertical, Europe, 2013–2020
- 83. Modular Data Centre Market: Percent Revenue Forecast by Application Type, Europe, 2013–2020
- 84. Modular Data Centre Market: Revenue Forecast by Application Type, Europe, 2013–2020
- 85. Big Data Application Market: Revenue, Europe, 2014–2025
- 86. Average Latency: Europe, 2015
- 87. Modular Data Centre Market: Percent Cost Split by Module Type, Europe, 2015
- 88. Modular Data Centre Market: Percent Cost Split by Module Type, Europe, 2020
- 89. Modular Data Centre Market: Cost Split by Module Type, Europe, 2015
- 90. Modular Data Centre Market: Cost Split by Module Type, Europe, 2020
- 91. Modular Data Centre Market: Market Engineering Measurements, APAC, 2015
- 92. Data Traffic—Consumer Internet Video: APAC, 2014–2019
- 93. Data Traffic—Mobile Data/Internet: APAC, 2014–2019
- 94. Workload Distribution–Cloud Data Centres vs. Traditional Data Centres: APAC, 2014–2019
- 95. Workload Distribution Growth Rate–Cloud Data Centres vs. Traditional Data Centres: APAC, 2014–2019
- 96. Modular Data Centre Market: Revenue Forecast, APAC, 2013–2020
- 97. Total Modular Data Centre Market: Percent Revenue Breakdown, Global, 2015
- 98. Modular Data Centre Market: Percent Revenue Forecast by End-user Vertical, APAC, 2013–2020
- 99. Modular Data Centre Market: Revenue Forecast by End-user Vertical, APAC, 2013–2020
- 100. Modular Data Centre Market: Percent Revenue Forecast by Application Type, APAC, 2013–2020
- 101. Modular Data Centre Market: Revenue Forecast by Application Type, APAC, 2013–2020
- 102. Average Latency, APAC, 2015
- 103. Modular Data Centre Market: Percent Cost Split by Module Type, APAC, 2015
- 104. Modular Data Centre Market: Percent Cost Split by Module Type, APAC, 2020
- 105. Modular Data Centre Market: Cost Split by Module Type, APAC, 2015
- 106. Modular Data Centre Market: Cost Split by Module Type, APAC, 2020
- 107. Modular Data Centre Market: Market Engineering Measurements, ROW, 2015
- 108. Data Traffic–Consumer Internet Video, ROW, 2014–2019
- 109. Data Traffic–Mobile Data/Internet, ROW, 2014–2019
- 110. Workload Distribution–Cloud Data Centres vs. Traditional Data Centres, MEA, 2014–2019
- 111. Workload Distribution Growth Rate–Cloud Data Centres vs. Traditional Data Centres, MEA, 2014–2019
- 112. Workload Distribution–Cloud Data Centre vs. Traditional Data Centre, LATAM, 2014–2019
- 113. Workload Distribution Growth Rate–Cloud Data Centre vs. Traditional Data Centre, LATAM, 2014–2019
- 114. Modular Data Centre Market: Revenue Forecast, ROW, 2013–2020
- 115. Total Modular Data Centre Market: Percent Revenue Breakdown, Global, 2015
- 116. Modular Data Centre Market: Percent Revenue Forecast by End-user Vertical, ROW, 2013–2020
- 117. Modular Data Centre Market: Revenue Forecast by End-user Vertical, ROW, 2013–2020
- 118. Modular Data Centre Market: Percent Revenue Forecast by Application Type, ROW, 2013–2020
- 119. Modular Data Centre Market: Revenue Forecast by Application Type, ROW, 2013–2020
- 120. Average Latency: LATAM, 2015
- 121. Average Latency, Middle East, 2015
- 122. Average Latency, Africa, 2015
- 123. Modular Data Centre Market: Percent Cost Split by Module Type, ROW, 2015
- 124. Modular Data Centre Market: Percent Cost Split by Module Type, ROW, 2020
- 125. Modular Data Centre Market: Cost Split by Module Type, ROW, 2015
- 126. Modular Data Centre Market: Cost Split by Module Type, ROW, 2020
Popular Topics
| No Index | No |
|---|---|
| Podcast | No |
| Table of Contents | | Executive Summary~ || Key Findings—Modular Data Centre Market~ || Market measurements~ ||| By Market ~ ||| By Competitor ~ ||| By Total Addressable Market~ ||| By Industry Advancements~ || CEO’s Perspective~ | Market overview~ || Trends Driving the Future of Data Centres, 2015–2020~ ||| Hybrid Model~ ||| Commoditised Data Centre Services~ ||| Modular Design~ ||| Dominance of Emerging Economies~ ||| Alternative Cooling Technologies~ ||| Operating Temperature~ ||| Increased Rack Power Density~ ||| Incremental Data Centre Consolidation~ ||| Next-generation DCIM~ ||| Alternative Power Sources~ | Total Modular Data Center market~ || Scope - Modular Data Centre’s~ || Market Definitions~ ||| By Modular Data Centres~ |||| Prefabricated Modular Data Centre~ |||| Containerized Data Centre~ || Market Segmentations~ ||| By Applications~ |||| By Disaster Recovery~ |||| By High Performance Computing (HPC)/Edge Computing~ |||| By Data Centre Augmentation~ |||| By Starter Data Centres~ ||| By End-User Vertical~ |||| IT~ |||| Telecom~ |||| Banking and Financial ~ |||| Government~ |||| Other End-user Verticals~ ||||| Percent Sales Breakdown by End-user Vertical, 2015~ ||||| Percent Revenue Breakdown by Application Type, 2015~ ||||| Percent Sales Breakdown by Region, 2015~ | Drivers and restraints - Total Modular Data Centre Market ~ || Drivers, 2016–2020~ ||| Features, functionalities and benefits~ |||| Key Advantages/Benefits, 2015~ ||| Increasing demand for data storage, security, and speed~ |||| Unprecedented Growth in Data Traffic~ ||||| Total IP Traffic, 2014–2020~ ||||| Percent Split of IP Traffic, 2014–2020~ ||||| Total Data Centre Traffic Growth Forecast, 2014–2020~ ||||| Total Traditional (Non-cloud) Data Centre Traffic Growth Forecast, 2014–2020~ ||| High growth in colocation and cloud services~ |||| Data Centre Market~ ||||| White Space Growth—Outsourced Data Centre vs. In-house, 2010, 2013 and 2015~ ||||| Year-over-year (YOY) Outsourced Footprint Growth Rate, 2014~ ||||| YOY Total Facilities Growth Rate, 2014~ ||||| Total Data Centre Workload, 2014–2020~ |||| Cloud Evolution~ ||||| By Percent Split of Data Centre Workload—Traditional vs. Cloud, 2014–2020~ ||||| Cloud Data Centre Traffic— by Region, 2014–2019~ ||||| Cloud Data Centre Traffic Growth Forecast, 2014–2020~ ||||| Percent of Data Centre Traffic—Cloud vs. Traditional, 2014–2020~ ||| Internet of Things (IoT) and Big Data~ |||| Implications for Modular Data Centres~ ||||| Higher Rack Density Levels~ ||||| Increased Inbound Data Centre Bandwidth Requirements~ ||||| Expansion of Cloud Data Centres~ ||||| Integrated IT Architecture~ |||| Global Drivers of IoT~ ||||| 5G Network~ ||||| Sensors~ ||||| Consumer Interest~ ||||| Internet Protocol version 6 (IPv6)~ ||||| Industry Interest~ |||| Big Data Analytics Market~ ||||| Revenue Forecast, 2015–2022~ ||||| Life Cycle Stage by Region, 2015~ ||||| Percent of Connected Devices by Segment, 2014, 2017 and 2020~ ||| Overall increase in global data centre investments~ |||| Data Centre Investment Trends~ ||||| Investment Forecast, 2012–2016~ ||||| Investment Forecast by Type, 2012 and 2016~ ||||| Investment Growth Rate Forecast by Investment Type, 2015 and 2016~ ||||| Regional Investment Highlights— A Snapshot~ || Restraints, 2016–2020~ ||| Scepticism towards implementing new technologies or unfamiliar solutions~ ||| Lack of awareness on modular products and lack of product knowledge~ |||| End-user Confidence in Modular Data Centre Technology, 2015~ |||| Modular Data Centre Market: End-user Concerns Limiting Adoption, 2015~ | Total Modular Data Centre Market - Forecasts and trends ~ || Market measurements, 2015~ ||| By Market Overview~ ||| By Competitor~ ||| By Total Addressable Market~ ||| By Industry Advancements~ ||| By Revenue Forecasts, 2013–2020~ |||| By Region~ ||||| Percent Revenue Forecast, 2013–2020~ ||||| Regional Attractiveness, 2015~ ||||| Revenue Forecast, 2013–2020~ |||| By End-user Vertical~ ||||| Percent Revenue Forecast, 2013–2020~ ||||| Segment Attractiveness, 2015~ ||||| Revenue Forecast, 2013–2020~ |||| By Application Type~ ||||| Percent Revenue Forecast, 2013–2020~ ||||| Segment Attractiveness, 2015~ ||||| Revenue Forecast, 2013–2020~ |||| By Module Type ~ ||||| Percent Cost Split, 2015~ ||||| Percent Cost Split, 2020~ | Market Share and competitive analysis ~ || Market Share~ ||| Percent Revenue Breakdown, 2015~ ||| Company Market Share Analysis of Top 5 Participants, 2015~ |||| Emerson Network Power~ |||| HP~ |||| Huawei~ |||| Dell~ |||| Schneider Electric~ ||| Top 3 Companies by Region~ ||| Competitive Structure, 2015~ | North America Analysis~ || Market Measurements, 2015~ || Market Trends~ ||| Data traffic, 2014–2019~ |||| Consumer Internet Video~ |||| Mobile Data/Internet~ ||| Data Centre Workload Distribution: Cloud versus Traditional, 2014–2019~ |||| Workload Distribution~ |||| Workload Distribution Growth Rate~ || Revenue Forecasts, 2013–2020~ ||| Percent Revenue Forecast by End-user Vertical~ ||| Revenue Forecast by End-user Vertical~ ||| Percent Revenue Forecast by Application Type~ ||| Revenue Forecast by Application Type~ ||| Cost Split by Module Type~ |||| For 2015~ |||| For 2020~ | Europe Analysis~ || Market Measurements, 2015~ || Market Trends~ ||| Data Traffic, 2014–2019~ |||| Consumer Internet Video~ |||| Mobile Data/Internet~ ||| Data Centre Workload Distribution: Cloud versus Traditional, 2014—2019~ |||| Western Europe~ ||||| Workload Distribution~ ||||| Workload Distribution Growth Rate~ |||| CEE~ ||||| Workload Distribution~ ||||| Workload Distribution Growth Rate~ || Revenue Forecasts, 2013–2020 ~ ||| Percent Revenue Forecast by End-user Vertical, Europe~ ||| Revenue Forecast by End-user Vertical, Europe~ ||| Percent Revenue Forecast by Application Type~ ||| Revenue Forecast by Application Type~ ||| Percent Cost Split by Module Type~ |||| For 2015~ |||| For 2020~ | APAC Analysis ~ || Market Measurements, 2015~ || Market Trends~ ||| Data traffic, 2014–2019~ |||| Consumer Internet Video~ |||| Mobile Data/Internet~ ||| Data Centre Workload Distribution: Cloud versus Traditional, 2014–2019 ~ |||| Workload Distribution~ |||| Workload Distribution Growth Rate~ || Revenue Forecast, 2013–2020~ ||| Percent Revenue Breakdown~ ||| Percent Revenue Forecast by End-user Vertical~ ||| Revenue Forecast by End-user Vertical~ ||| Percent Revenue Forecast by Application Type~ ||| Revenue Forecast by Application Type~ ||| Percent Cost Split by Module Type~ |||| For 2015~ |||| For 2020~ | ROW Analysis~ || Market Measurements, 2015~ || Market trends ~ ||| Data Traffic, 2014–2019~ |||| Consumer Internet Video~ |||| Mobile Data/Internet~ ||| Data Centre Workload Distribution: Cloud versus Traditional, 2014–2019~ |||| MEA~ ||||| Workload Distribution~ ||||| Workload Distribution Growth Rate~ |||| LATAM~ ||||| Workload Distribution~ ||||| Workload Distribution Growth Rate~ || Revenue Forecast, 2013–2020~ ||| Percent Revenue Forecast by End-user Vertical~ ||| Revenue Forecast by End-user Vertical~ ||| Percent Revenue Forecast by Application Type~ ||| Revenue Forecast by Application Type~ ||| Percent Cost Split by Module Type~ |||| For 2015~ |||| For 2020~ | The Last Word~ || 3 Big Predictions~ || Disclaimer~ | Appendix~ || Market Methodology~ || Partial List of Other Companies~ |
| List of Charts and Figures | 1. Total Modular Data Centre Market: Market Engineering Measurements, Global, 2015~ 2. Total Data Modular Centre Market: Data Centre of Tomorrow, Global, 2015–2020~ 3. Total Modular Data Centre Market: Percent Sales Breakdown by End-user Vertical, Global, 2015~ 4. Total Modular Data Centre Market: Percent Revenue Breakdown by Application Type, Global, 2015~ 5. Total Modular Data Centre Market: Percent Sales Breakdown by Region, Global, 2015~ 6. Total Modular Data Centre Market: Key Market Drivers, Global, 2016–2020~ 7. Total Modular Data Centre Market: Key Advantages/Benefits of a Modular Data Centre, Global, 2015~ 8. Total IP Traffic: Global, 2014–2020~ 9. Percent Split of IP Traffic—Fixed Internet vs. Managed IP vs. Mobile Data: Global, 2014–2020~ 10. Total Data Centre Traffic Growth Forecast: Global, 2014–2020~ 11. Total Traditional (Non-cloud) Data Centre Traffic Growth Forecast: Global, 2014–2020~ 12. Data Centre Market: Year-over-year (YOY) Outsourced Footprint Growth Rate, Global, 2014~ 13. Data Centre Market: White Space Growth—Outsourced Data Centre vs. In-house, Global, 2010, 2013, and 2015~ 14. Data Centre Market: YOY Total Facilities Growth Rate, Global, 2014~ 15. Total Data Centre Workload: Global, 2014–2020~ 16. Percent Split of Data Centre Workload—Traditional vs. Cloud: Global, 2014–2020~ 17. Cloud Data Centre Traffic—CAGR by Region: Global, 2014–2019~ 18. Cloud Data Centre Traffic Growth Forecast: Global, 2014–2020~ 19. Percent of Data Centre Traffic—Cloud vs. Traditional: Global, 2014–2020~ 20. Unprecedented growth in IoT and Big Data will play a crucial role in modular data centre market expansion.~ 21. Global Drivers of IoT~ 22. Big Data Analytics Market: Revenue Forecast, Global, 2015–2022~ 23. Big Data Analytics Market: Life Cycle Stage by Region, Global, 2015~ 24. Percent of Connected Devices by Segment: Global, 2014, 2017, and 2020~ 25. Data Centre Market: Investment Forecast, Global, 2012–2016~ 26. Data Centre Market: Investment Forecast by Type, Global, 2012 and 2016~ 27. Data Centre Market: Investment Growth Rate Forecast by Investment Type, Global, 2015 and 2016~ 28. Regional Investment Highlights—Snapshot~ 29. Total Modular Data Centre Market: Key Market Restraints, Global, 2016–2020~ 30. End-user Confidence in Modular Data Centre Technology: Global, 2015~ 31. Modular Data Centre Market: End-user Concerns Limiting Adoption, Global 2015~ 32. Total Modular Data Centre Market: Market Engineering Measurements, Global, 2015~ 33. Total Modular Data Centre Market: Revenue Forecast, Global, 2013–2020~ 34. Total Modular Data Centre Market: Percent Revenue Forecast by Region, Global, 2013–2020~ 35. Total Modular Data Centre Market: Regional Attractiveness, Global, 2015~ 36. Total Modular Data Centre Market: Revenue Forecast by Region, Global, 2013–2020~ 37. Total Modular Data Centre Market: Percent Revenue Forecast by End-user Vertical, Global, 2013–2020~ 38. Total Modular Data Centre Market: Segment Attractiveness by End-user Vertical, Global, 2015~ 39. Total Modular Data Centre Market: Revenue Forecast by End-user Vertical, Global, 2013–2020~ 40. Total Modular Data Centre Market: Percent Revenue Forecast by Application Type, Global, 2013–2020~ 41. Total Modular Data Centre Market: Segment Attractiveness by Application Type, Global, 2015~ 42. Total Modular Data Centre Market: Revenue Forecast by Application Type, Global, 2013–2020~ 43. IaaS Market: Revenue Forecast, US, 2013–2020~ 44. IaaS Market: Revenue Forecast, Europe, 2013–2020~ 45. Regional Internet Penetration—Fixed Line Internet vs. Mobile Internet: Global, 2014~ 46. Regional Internet Penetration—Fixed Line Internet vs. Mobile Internet: Global, 2019~ 47. Average Latency by Region: Global, 2015~ 48. Total Modular Data Centre Market: Percent Cost Split by Module Type, Global, 2015~ 49. Total Modular Data Centre Market: Percent Cost Split by Module Type, Global, 2020~ 50. Total Modular Data Centre Market: Cost Split by Module Type, Global, 2015~ 51. Total Modular Data Centre Market: Cost Split by Module Type, Global, 2020~ 52. Total Modular Data Centre Market: Percent Revenue Breakdown, Global, 2015~ 53. Total Modular Data Centre Market: Company Market Share Analysis of Top 5 Participants, Global, 2015~ 54. Modular Data Centre Market—Top 3 Companies by Region~ 55. Total Modular Data Centre Market: Competitive Structure, Global, 2015~ 56. Modular Data Centre Market: Market Engineering Measurements, North America, 2015~ 57. Data Traffic–Consumer Internet Video: North America, 2014–2019~ 58. Data Traffic–Mobile Data/Internet: North America, 2014–2019~ 59. Workload Distribution–Cloud Data Centres vs. Traditional Data Centres: North America, 2014–2019~ 60. Workload Distribution Growth Rate–Cloud Data Centres vs. Traditional Data Centres: North America, 2014–2019~ 61. Modular Data Centre Market: Revenue Forecast, North America, 2013–2020~ 62. Total Modular Data Centre Market: Percent Revenue Breakdown, Global, 2015~ 63. Modular Data Centre Market: Percent Revenue Forecast by End-user Vertical, North America, 2013–2020~ 64. Modular Data Centre Market: Revenue Forecast by End-user Vertical Segment, North America, 2013–2020~ 65. Modular Data Centre Market: Percent Revenue Forecast by Application Type, North America, 2013–2020~ 66. Modular Data Centre Market: Revenue Forecast by Application Type, North America, 2013–2020~ 67. Average Latency: North America, 2015~ 68. Modular Data Centre Market: Percent Cost Split by Module Type, North America, 2015~ 69. Modular Data Centre Market: Percent Cost Split by Module Type, North America, 2020~ 70. Modular Data Centre Market: Cost Split by Module Type, North America, 2015~ 71. Modular Data Centre Market: Cost Split by Module Type, North America, 2020~ 72. Modular Data Centre Market: Market Engineering Measurements, Europe, 2015~ 73. Data Traffic–Consumer Internet Video: Europe, 2014–2019~ 74. Data Traffic–Mobile Data/Internet: Europe, 2014–2019~ 75. Workload Distribution–Cloud Data Centres vs. Traditional Data Centres: Western Europe, 2014—2019 ~ 76. Workload Distribution Growth Rate–Cloud Data Centres vs. Traditional Data Centres: Western Europe, 2014–2019 ~ 77. Workload Distribution–Cloud Data Centres vs. Traditional Data Centres: CEE, 2014–2019~ 78. Workload Distribution Growth Rate–Cloud Data Centres vs. Traditional Data Centres: CEE, 2014–2019~ 79. Modular Data Centre Market: Revenue Forecast, Europe, 2013–2020~ 80. Total Modular Data Centre Market: Percent Revenue Breakdown, Global, 2015~ 81. Modular Data Centre Market: Percent Revenue Forecast by End-user Vertical, Europe, 2013–2020~ 82. Modular Data Centre Market: Revenue Forecast by End-user Vertical, Europe, 2013–2020~ 83. Modular Data Centre Market: Percent Revenue Forecast by Application Type, Europe, 2013–2020~ 84. Modular Data Centre Market: Revenue Forecast by Application Type, Europe, 2013–2020~ 85. Big Data Application Market: Revenue, Europe, 2014–2025~ 86. Average Latency: Europe, 2015~ 87. Modular Data Centre Market: Percent Cost Split by Module Type, Europe, 2015~ 88. Modular Data Centre Market: Percent Cost Split by Module Type, Europe, 2020~ 89. Modular Data Centre Market: Cost Split by Module Type, Europe, 2015~ 90. Modular Data Centre Market: Cost Split by Module Type, Europe, 2020~ 91. Modular Data Centre Market: Market Engineering Measurements, APAC, 2015~ 92. Data Traffic—Consumer Internet Video: APAC, 2014–2019~ 93. Data Traffic—Mobile Data/Internet: APAC, 2014–2019~ 94. Workload Distribution–Cloud Data Centres vs. Traditional Data Centres: APAC, 2014–2019 ~ 95. Workload Distribution Growth Rate–Cloud Data Centres vs. Traditional Data Centres: APAC, 2014–2019 ~ 96. Modular Data Centre Market: Revenue Forecast, APAC, 2013–2020~ 97. Total Modular Data Centre Market: Percent Revenue Breakdown, Global, 2015~ 98. Modular Data Centre Market: Percent Revenue Forecast by End-user Vertical, APAC, 2013–2020~ 99. Modular Data Centre Market: Revenue Forecast by End-user Vertical, APAC, 2013–2020~ 100. Modular Data Centre Market: Percent Revenue Forecast by Application Type, APAC, 2013–2020~ 101. Modular Data Centre Market: Revenue Forecast by Application Type, APAC, 2013–2020~ 102. Average Latency, APAC, 2015~ 103. Modular Data Centre Market: Percent Cost Split by Module Type, APAC, 2015~ 104. Modular Data Centre Market: Percent Cost Split by Module Type, APAC, 2020~ 105. Modular Data Centre Market: Cost Split by Module Type, APAC, 2015~ 106. Modular Data Centre Market: Cost Split by Module Type, APAC, 2020~ 107. Modular Data Centre Market: Market Engineering Measurements, ROW, 2015~ 108. Data Traffic–Consumer Internet Video, ROW, 2014–2019~ 109. Data Traffic–Mobile Data/Internet, ROW, 2014–2019~ 110. Workload Distribution–Cloud Data Centres vs. Traditional Data Centres, MEA, 2014–2019 ~ 111. Workload Distribution Growth Rate–Cloud Data Centres vs. Traditional Data Centres, MEA, 2014–2019 ~ 112. Workload Distribution–Cloud Data Centre vs. Traditional Data Centre, LATAM, 2014–2019 ~ 113. Workload Distribution Growth Rate–Cloud Data Centre vs. Traditional Data Centre, LATAM, 2014–2019 ~ 114. Modular Data Centre Market: Revenue Forecast, ROW, 2013–2020~ 115. Total Modular Data Centre Market: Percent Revenue Breakdown, Global, 2015~ 116. Modular Data Centre Market: Percent Revenue Forecast by End-user Vertical, ROW, 2013–2020~ 117. Modular Data Centre Market: Revenue Forecast by End-user Vertical, ROW, 2013–2020~ 118. Modular Data Centre Market: Percent Revenue Forecast by Application Type, ROW, 2013–2020~ 119. Modular Data Centre Market: Revenue Forecast by Application Type, ROW, 2013–2020~ 120. Average Latency: LATAM, 2015~ 121. Average Latency, Middle East, 2015~ 122. Average Latency, Africa, 2015~ 123. Modular Data Centre Market: Percent Cost Split by Module Type, ROW, 2015~ 124. Modular Data Centre Market: Percent Cost Split by Module Type, ROW, 2020~ 125. Modular Data Centre Market: Cost Split by Module Type, ROW, 2015~ 126. Modular Data Centre Market: Cost Split by Module Type, ROW, 2020~ |
| Author | Gautham Gnanajothi |
| Industries | Energy |
| WIP Number | MB3F-01-00-00-00 |
| Is Prebook | No |