 USD
USD GBP
GBP CNY
CNY EUR
EUR INR
INR JPY
JPY MYR
MYR ZAR
ZAR KRW
KRW THB
THBGulf Cooperation Council Mobile Value Added Services Market
Gulf Cooperation Council Mobile Value Added Services Market
Applications to Capture the Wallet Share of Customers
17-Dec-2015
South Asia, Middle East & North Africa
Description
This is a study on the Mobile Value Added Services (MVAS) market in the Gulf Cooperation Council (GCC) Region in 2014. It analyzes market trends, MVAS products, and trends in the 6 countries in the region and the market forecast for the period 2014–2020. The MVAS market continues to grow with data applications and vernacular content based VAS products. The study covers the competitive environment in each country with focus on major MVAS products in the market. The market segments covered in this study are non-voice services such, data services, and other Wireless Application Protocol (WAP), Interactive Voice Response (IVR), Interactive Voice and Video Response (IVVR), and Unstructured Supplementary Service Data (USSD) based services.
RESEARCH: INFOGRAPHIC
This infographic presents a brief overview of the research, and highlights the key topics discussed in it.Click image to view it in full size
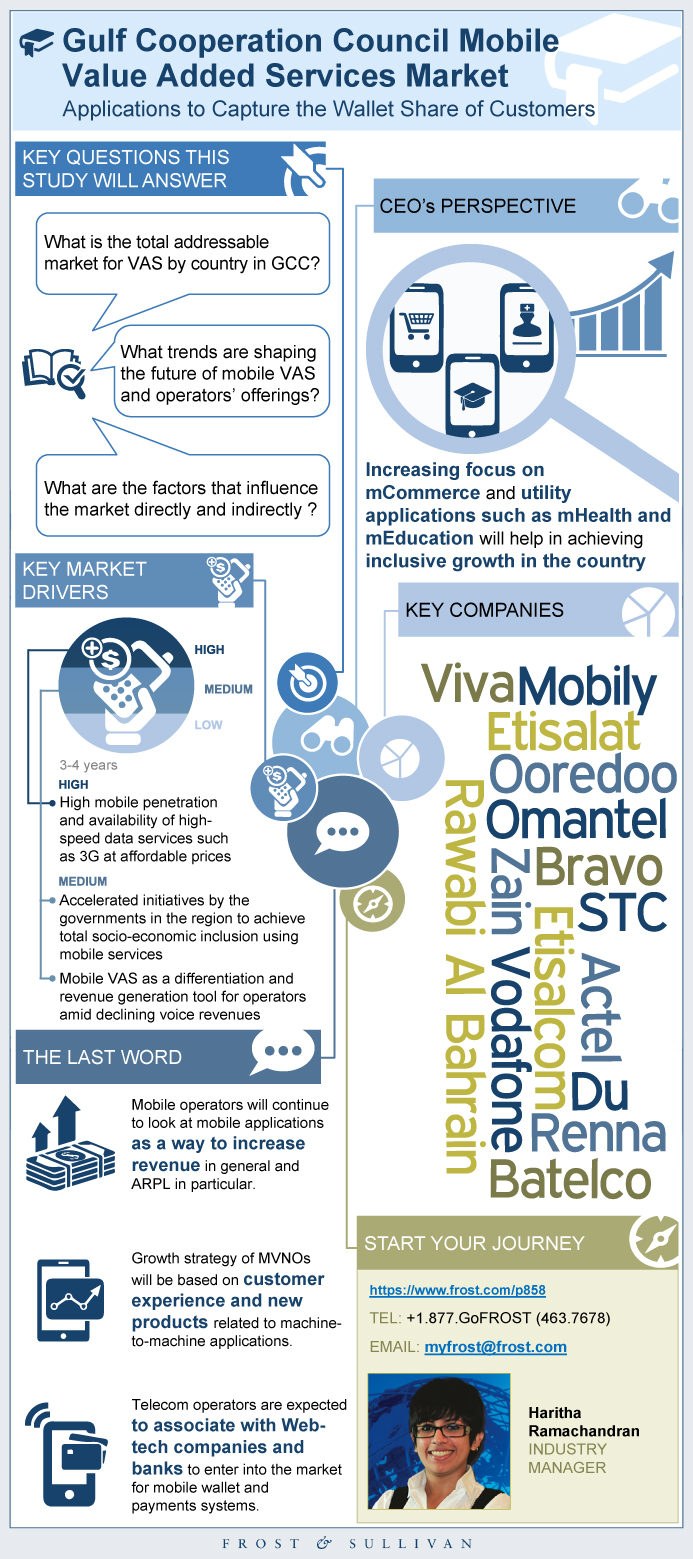
Table of Contents
Key Findings
Market Engineering Measurements
CEO’s Perspective
Market Definitions
Aims and Objectives
Geographic Scope
- Mobile VAS
- P2P SMS
- A2P SMS
- P2A SMS
Market Drivers
Market Restraints
Mobile Applications Market
Mobile Applications Revenue and Business Models
Revenue Sharing Model in the VAS Industry
Revenue Forecast
Revenue Forecast by Country
Percent Revenue Forecast by Country
Market Segmentation by Service
- One Time Payments
- Subscription Services
- App Stores
Competitive Environment
Market Engineering Measurements, KSA, 2014
Revenue Forecast, KSA, 2014–2020, CAGR = 14.5%
Percent Revenue Breakdown by Service Provider, KSA, 2014
Competitive Structure, KSA, 2014
Top Competitors—Telecom Operators, KSA, 2014
Market Engineering Measurements, Bahrain, 2014
Revenue Forecast, Bahrain, 2014–2020, CAGR = 14.5%
Percent Revenue Breakdown by Service Provider, Bahrain, 2014
Competitive Structure, Bahrain, 2014
Top Competitors—Telecom Operators, Bahrain, 2014
Market Engineering Measurements, Qatar, 2014
Revenue Forecast, Qatar, 2014–2020, CAGR = 14.5%
Percent Revenue Breakdown by Service Provider, Qatar, 2014
Competitive Structure, Qatar, 2014
Top Competitors—Telecom Operators, Qatar, 2014
Market Engineering Measurements, UAE, 2014
Revenue Forecast, UAE, 2014–2020, CAGR = 14.5%
Percent Revenue Breakdown by Service Provider, UAE, 2014
Competitive Structure, UAE, 2014
Top Competitors—Telecom Operators, UAE, 2014
Market Engineering Measurements, Other GCC Countries, 2014
Revenue Forecast, Other GCC Countries, 2014–2020, CAGR = 14.5%
Percent Revenue Breakdown by Service Provider, Other GCC Countries, 2014
Competitive Structure, Other GCC Countries, 2014
Top Competitors—Telecom Operators, Other GCC Countries, 2014
Legal Disclaimer
- 1. Market Definitions – Scope
- 2. Market Overview—Aims and Objectives
- 3. Market Overview—Geographic Scope
- 4. Total Mobile VAS Market: Key Market Drivers, GCC Countries, 2015–2020
- 5. Total Mobile VAS Market: Key Market Restraints, GCC Countries, 2015–2020
- 6. Mobile Applications Market
- 7. Revenue Sharing Model in the VAS Industry
- 8. Total Mobile VAS Market: Competitive Environment, GCC Countries, 2014
- 9. Mobile VAS Market: Market Engineering Measurements, KSA, 2014
- 10. Mobile VAS Market: Competitive Structure, KSA, 2014
- 11. Mobile VAS Market: Telecom Operators, KSA, 2014
- 12. Mobile VAS Market: Market Engineering Measurements, Bahrain, 2014
- 13. Mobile VAS Market: Competitive Structure, Bahrain, 2014
- 14. Mobile VAS Market: Telecom Operators, Bahrain, 2014
- 15. Mobile VAS Market: Market Engineering Measurements, Qatar, 2014
- 16. Mobile VAS Market: Competitive Structure, Qatar, 2014
- 17. Mobile VAS Market: Telecom Operators, Qatar, 2014
- 18. Mobile VAS Market: Market Engineering Measurements, UAE, 2014
- 19. Mobile VAS Market: Competitive Structure, UAE, 2014
- 20. Mobile VAS Market: Telecom Operators, UAE, 2014
- 21. Mobile VAS Market: Market Engineering Measurements, Other GCC Countries, 2014
- 22. Mobile VAS Market: Competitive Structure, Other GCC Countries, 2014
- 23. Mobile VAS Market: Telecom Operators, Other GCC Countries, 2014
- 1. Total Mobile VAS Market: Revenue Forecast, GCC Countries, 2014–2020, Revenue CAGR, 2014–2020
- 2. Total Mobile VAS Market: Revenue Forecast by Country, GCC Countries, 2014–2020
- 3. Total Mobile VAS Market: Percent Revenue Forecast by Country, GCC Countries, 2014 and 2020
- 4. Total Mobile VAS Market: Market Segmentation by Service, GCC Countries, 2014
- 5. Mobile VAS Market: Revenue Forecast, KSA, 2014–2020, CAGR
- 6. Mobile VAS Market: Percent Revenue Breakdown by Service Provider, KSA, 2014
- 7. Mobile VAS Market: Revenue Forecast, Bahrain, 2014–2020, CAGR
- 8. Mobile VAS Market: Percent Revenue Breakdown by Service Provider, Bahrain, 2014
- 9. Mobile VAS Market: Revenue Forecast, Qatar, 2014–2020, CAGR
- 10. Mobile VAS Market: Percent Revenue Breakdown by Service Provider, Qatar, 2014
- 11. Mobile VAS Market: Revenue Forecast, UAE, 2014–2020, CAGR
- 12. Mobile VAS Market: Percent Revenue Breakdown by Service Provider, UAE, 2014
- 13. Mobile VAS Market: Revenue Forecast, Other GCC Countries, 2014–2020, CAGR
- 14. Mobile VAS Market: Percent Revenue Breakdown by Service Provider, Other GCC Countries, 2014
Popular Topics
| No Index | No |
|---|---|
| Podcast | No |
| Table of Contents | | Executive Summary~ || Key Findings~ || Market Engineering Measurements~ || CEO’s Perspective~ | Market Overview~ || Market Definitions~ ||| Mobile VAS~ ||| P2P SMS~ ||| A2P SMS~ ||| P2A SMS~ || Aims and Objectives~ || Geographic Scope~ ||| The Kingdom of Saudi Arabia (KSA)~ ||| The United Arab Emirates (UAE)~ ||| Qatar~ ||| Kuwait~ ||| Oman~ ||| Bahrain~ | Drivers and Restraints—Total Mobile VAS Market~ || Market Drivers~ ||| High mobile penetration~ ||| Accelerated initiatives by the governments in the region~ ||| Mobile VAS as a differentiation and revenue generation tool~ ||| Increased availability of affordable multifunction handsets~ ||| High usage of media and infotainment through 3G services~ || Market Restraints~ ||| Absence of a transparent revenue sharing model~ ||| Lack of awareness~ ||| Security concerns~ ||| Revenue sharing is heavily skewed toward telecom operators~ | Forecasts and Trends—Total Mobile VAS Market~ || Mobile Applications Market~ || Mobile Applications Revenue and Business Models~ ||| One Time Payments~ ||| Subscription Services~ ||| App Stores~ || Revenue Sharing Model in the VAS Industry~ || Revenue Forecast~ || Revenue Forecast by Country~ || Percent Revenue Forecast by Country~ || Market Segmentation by Service~ | Market Share and Competitive Analysis— Total Mobile VAS Market~ || Competitive Environment~ | KSA Breakdown~ || Market Engineering Measurements, KSA, 2014~ || Revenue Forecast, KSA, 2014–2020, CAGR = 14.5%~ || Percent Revenue Breakdown by Service Provider, KSA, 2014~ || Competitive Structure, KSA, 2014~ || Top Competitors—Telecom Operators, KSA, 2014~ | Bahrain Breakdown~ || Market Engineering Measurements, Bahrain, 2014~ || Revenue Forecast, Bahrain, 2014–2020, CAGR = 14.5%~ || Percent Revenue Breakdown by Service Provider, Bahrain, 2014~ || Competitive Structure, Bahrain, 2014~ || Top Competitors—Telecom Operators, Bahrain, 2014~ | Qatar Breakdown~ || Market Engineering Measurements, Qatar, 2014~ || Revenue Forecast, Qatar, 2014–2020, CAGR = 14.5%~ || Percent Revenue Breakdown by Service Provider, Qatar, 2014~ || Competitive Structure, Qatar, 2014~ || Top Competitors—Telecom Operators, Qatar, 2014 ~ | UAE Breakdown~ || Market Engineering Measurements, UAE, 2014~ || Revenue Forecast, UAE, 2014–2020, CAGR = 14.5%~ || Percent Revenue Breakdown by Service Provider, UAE, 2014~ || Competitive Structure, UAE, 2014~ || Top Competitors—Telecom Operators, UAE, 2014 ~ | Other GCC Countries Breakdown—Oman and Kuwait~ || Market Engineering Measurements, Other GCC Countries, 2014~ || Revenue Forecast, Other GCC Countries, 2014–2020, CAGR = 14.5%~ || Percent Revenue Breakdown by Service Provider, Other GCC Countries, 2014~ || Competitive Structure, Other GCC Countries, 2014~ || Top Competitors—Telecom Operators, Other GCC Countries, 2014 ~ | The Last Word~ || Legal Disclaimer~ | Appendix~ |
| List of Charts and Figures | 1. Market Definitions – Scope~ 2. Market Overview—Aims and Objectives~ 3. Market Overview—Geographic Scope~ 4. Total Mobile VAS Market: Key Market Drivers, GCC Countries, 2015–2020~ 5. Total Mobile VAS Market: Key Market Restraints, GCC Countries, 2015–2020~ 6. Mobile Applications Market~ 7. Revenue Sharing Model in the VAS Industry~ 8. Total Mobile VAS Market: Competitive Environment, GCC Countries, 2014~ 9. Mobile VAS Market: Market Engineering Measurements, KSA, 2014~ 10. Mobile VAS Market: Competitive Structure, KSA, 2014~ 11. Mobile VAS Market: Telecom Operators, KSA, 2014~ 12. Mobile VAS Market: Market Engineering Measurements, Bahrain, 2014~ 13. Mobile VAS Market: Competitive Structure, Bahrain, 2014~ 14. Mobile VAS Market: Telecom Operators, Bahrain, 2014~ 15. Mobile VAS Market: Market Engineering Measurements, Qatar, 2014~ 16. Mobile VAS Market: Competitive Structure, Qatar, 2014~ 17. Mobile VAS Market: Telecom Operators, Qatar, 2014~ 18. Mobile VAS Market: Market Engineering Measurements, UAE, 2014~ 19. Mobile VAS Market: Competitive Structure, UAE, 2014~ 20. Mobile VAS Market: Telecom Operators, UAE, 2014~ 21. Mobile VAS Market: Market Engineering Measurements, Other GCC Countries, 2014~ 22. Mobile VAS Market: Competitive Structure, Other GCC Countries, 2014~ 23. Mobile VAS Market: Telecom Operators, Other GCC Countries, 2014~| 1. Total Mobile VAS Market: Revenue Forecast, GCC Countries, 2014–2020, Revenue CAGR, 2014–2020~ 2. Total Mobile VAS Market: Revenue Forecast by Country, GCC Countries, 2014–2020~ 3. Total Mobile VAS Market: Percent Revenue Forecast by Country, GCC Countries, 2014 and 2020~ 4. Total Mobile VAS Market: Market Segmentation by Service, GCC Countries, 2014~ 5. Mobile VAS Market: Revenue Forecast, KSA, 2014–2020, CAGR~ 6. Mobile VAS Market: Percent Revenue Breakdown by Service Provider, KSA, 2014~ 7. Mobile VAS Market: Revenue Forecast, Bahrain, 2014–2020, CAGR~ 8. Mobile VAS Market: Percent Revenue Breakdown by Service Provider, Bahrain, 2014~ 9. Mobile VAS Market: Revenue Forecast, Qatar, 2014–2020, CAGR~ 10. Mobile VAS Market: Percent Revenue Breakdown by Service Provider, Qatar, 2014~ 11. Mobile VAS Market: Revenue Forecast, UAE, 2014–2020, CAGR~ 12. Mobile VAS Market: Percent Revenue Breakdown by Service Provider, UAE, 2014~ 13. Mobile VAS Market: Revenue Forecast, Other GCC Countries, 2014–2020, CAGR~ 14. Mobile VAS Market: Percent Revenue Breakdown by Service Provider, Other GCC Countries, 2014~ |
| Author | Goutham B |
| Industries | Telecom |
| WIP Number | P858-01-00-00-00 |
| Is Prebook | No |