 USD
USD GBP
GBP CNY
CNY EUR
EUR INR
INR JPY
JPY MYR
MYR ZAR
ZAR KRW
KRW THB
THBGrowth Opportunities in the Asia-Pacific Demand Response Market, Forecast to 2025
Growth Opportunities in the Asia-Pacific Demand Response Market, Forecast to 2025
Actual Accumulated Demand Response Resources to Cross 30GW by 2025
02-Jul-2018
Asia Pacific
$4,950.00
Special Price $3,712.50 save 25 %
Description
The Asia-Pacific demand response market is in the growing stage with countries such as South Korea, Japan, and New Zealand in the forefront. The liberalization of electricity markets and increasing distributed energy resources have a major role in driving the growth of demand response. However, lack of standardized procedures and absence of incentives deter the market growth in most countries in the region. Australia and Singapore are other notable countries that are aiming to establish an effective DR system in the electricity markets. Countries such as Japan, Australia, and Singapore are still testing the impacts and feasibility of demand response. However, after 2020, the market is expected to grow strongly with the introduction of demand response for ancillary services in the power sector. Liberalization of the electricity sector is a major drive for demand response market in the region. Besides, aggregation of distributed resources, energy storage system installations are offering opportunities for demands response. Most countries in the region are test trialling demand response to understand the economic benefits of it to evaluate the necessary incentives to be proposed to promote customer participation. Demand response requires interoperability of DRMS, connected appliances or equipment, network operation center, and so on. This requires these components to be standardized to ensure effective communication between them. Lack of standardization hinders proper adoption of the technology and deters demand response growth. Key Asia-Pacific markets include South Korea, Japan, Australia, and Singapore. South Korea is leading the path with 3.88 GW in 2017. Emergency demand response constitutes the majority (approximately 70%) of the total demand response market. The Japanese, Australian, and Singaporean markets operate primarily in this model. Implicit DR pricing models can be expected to become popular during the next 5 years. With the integration of more resources under DR aggregation model, cloud-based DR or SaaS model is expected to become popular. This would make the integration of residential resources to the cloud much easier. Besides, DR emerges as a secondary revenue model for energy storage systems, which were installed for power quality improvement, renewable energy fluctuation mitigation, and so on.
Key Issues Addressed
- Do current technologies meet the demand response needs or is additional development needed?
- Which are the key geographical hotspots for demand response market?
- What trends can be expected in the market during next 5-8 years?
- Which are the major companies active in the demand response market?
- What are the emerging business models in the demand response market?
RESEARCH: INFOGRAPHIC
This infographic presents a brief overview of the research, and highlights the key topics discussed in it.Click image to view it in full size
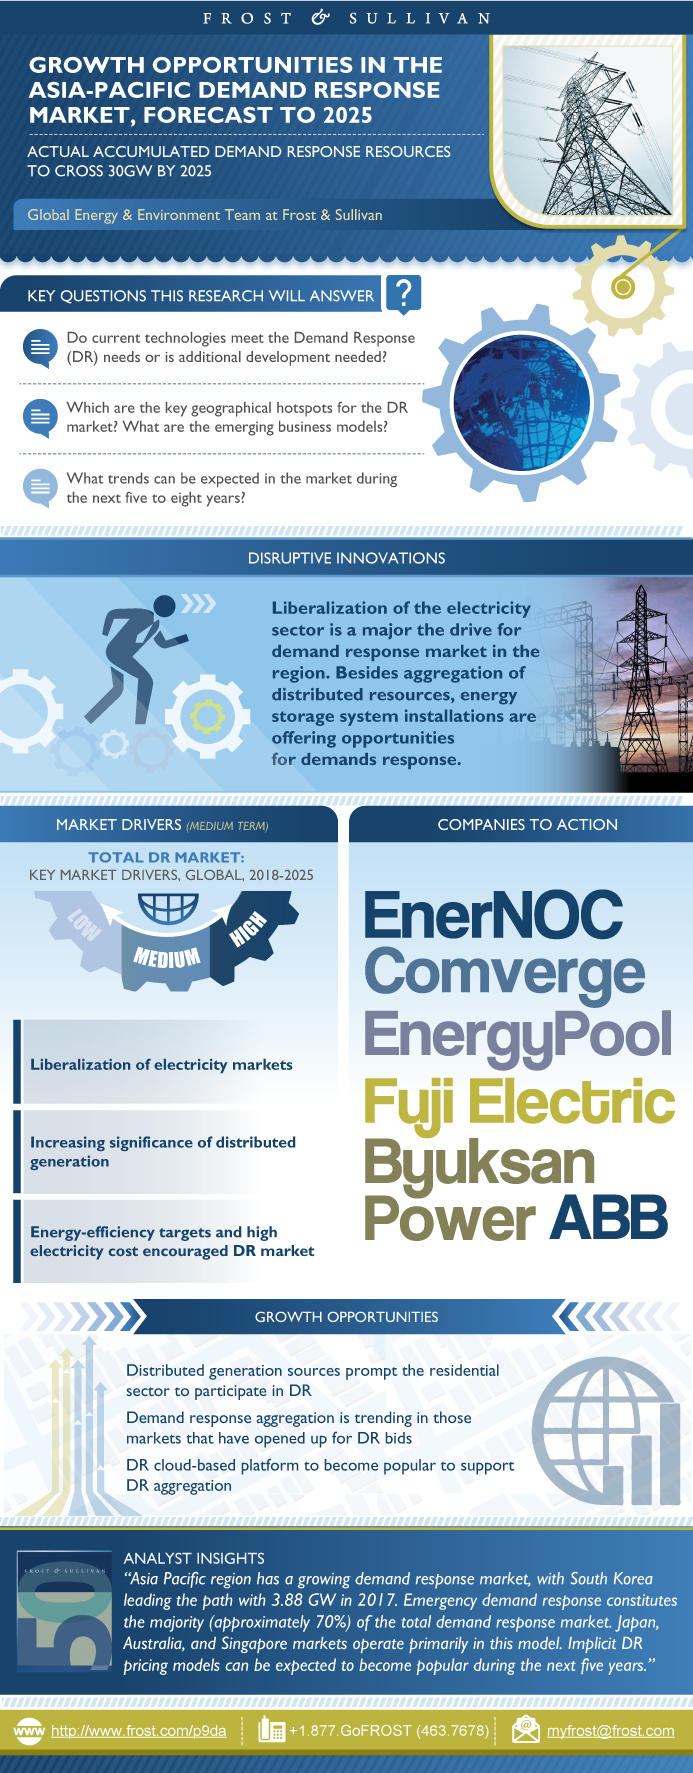
Table of Contents
Purpose of this Experiential Study
5 Step Process to Transformational Growth
Executive Summary—Key Findings
Strategic Imperatives for Suppliers
Geographic Scope and Exchange Rates
Market Overview—Definition
Questions Addressed in the Study
Market Overview—Classification of DR
Market Overview—Customer Segmentation
Market Overview—Energy-efficiency Targets*
Market Overview—Factors Leading to DR
Market Attractiveness
Drivers and Restraints
Revenue Forecast —Total DR Market
Revenue Forecast by Region
Competitive Analysis—DR Service Providers
Competitive Analysis—DR Software Solution
Competitive Analysis—Capability Matrix
Business Models—Virtual Power Plant (VPP) Model
Business Models—Global Hotspots
Macro to Micro Visioning
Trends /Factors Impacting the DR Market
Top Predictions for the DR Market
Levers for Growth
Growth Opportunity 1—Liberalization of Electricity Market
Growth Opportunity 2—Intelligent Energy Devices, Data Analytics,
and Cloud Platform
Growth Opportunity 3—Shrinking Reserve Margin
Growth Opportunity 4—Energy Storage Systems and VPP Model
Growth Opportunity 5—Vehicle-to-Grid (V2G) Application with DR
Identifying Your Company’s Growth Zone
Growth Opportunities 1-5—Vision and Strategy
Growth Opportunities Matrix
Growth Strategies for Your Company
Prioritized Opportunities through Implementation
Legal Disclaimer
Abbreviations and Acronyms Used
Other Companies
List of Exhibits
- 1. Total DR Market: Classification of DR, Asia-Pacific, 2017
- 2. Total DR Market: Factors Leading to DR, Asia-Pacific, 2017
- 3. Total DR Market: Key Market Drivers and Restraints, Global, 2018–2025
- 4. Total DR Market: Revenue Flow Chart, Asia-Pacific, 2017
- 5. Total DR Market: Competitive Landscape of Service Providers, Asia-Pacific, 2017
- 6. Total DR Market: Competitive Landscape of Software Solution, Asia-Pacific, 2017
- 7. Total DR Market: Competitor Capability Matrix, Asia-Pacific, 2017
- 8. Total DR Market: Electricity Value Chain, Asia-Pacific, 2017
- 9. Total DR Market: Stakeholder Roles in the DR Aggregator Model, Asia-Pacific, 2017
- 10. Total DR Market: DR Aggregator Business Model—Regional Highlights, Global, 2017
- 1. Total DR Market: Revenue Forecast, Asia-Pacific, 2017–2025
- 2. Total DR Market: Percent Revenue Forecast by Region, Asia-pacific, 2017–2025
- 3. Total Demand Response Market: Key Market Drivers & Restraints, Asia-Pacific, 2018–2025
- 4. Total DR Market: Percent Revenue Split by End Users, Asia-Pacific, 2017
- 5. Total DR Market: Percent Revenue Split by End Users, Asia-Pacific, 2017
- 6. Total Demand Response Market: Overall DR Attractiveness* by Country, Asia-Pacific, 2017
- 7. Total DR Market: Revenue Forecast, Asia-Pacific, 2016–2025
- 8. Total DR Market: Revenue Forecast by Region, Asia-Pacific, 2016–2025
Popular Topics
| No Index | No |
|---|---|
| Podcast | No |
| Table of Contents | | Executive Dashboard~ || Purpose of this Experiential Study~ || 5 Step Process to Transformational Growth~ || Executive Summary—Key Findings~ || Strategic Imperatives for Suppliers~ | Growth Environment—Market Overview~ || Geographic Scope and Exchange Rates~ || Market Overview—Definition~ || Questions Addressed in the Study~ || Market Overview—Classification of DR~ || Market Overview—Customer Segmentation~ || Market Overview—Energy-efficiency Targets*~ || Market Overview—Factors Leading to DR~ || Market Attractiveness~ || Drivers and Restraints~ | Market Forecast~ || Revenue Forecast —Total DR Market~ || Revenue Forecast by Region~ || Competitive Analysis—DR Service Providers~ || Competitive Analysis—DR Software Solution~ || Competitive Analysis—Capability Matrix~ || Business Models—Virtual Power Plant (VPP) Model~ || Business Models—Global Hotspots~ | Visioning Scenarios~ || Macro to Micro Visioning~ || Trends /Factors Impacting the DR Market~ || Top Predictions for the DR Market~ | Growth Pipeline~ || Levers for Growth~ | Vision and Strategy—Growth Opportunities~ || Growth Opportunity 1—Liberalization of Electricity Market~ || Growth Opportunity 2—Intelligent Energy Devices, Data Analytics, ~ || and Cloud Platform~ || Growth Opportunity 3—Shrinking Reserve Margin~ || Growth Opportunity 4—Energy Storage Systems and VPP Model~ || Growth Opportunity 5—Vehicle-to-Grid (V2G) Application with DR~ | Growth Opportunities Matrix~ || Identifying Your Company’s Growth Zone~ || Growth Opportunities 1-5—Vision and Strategy~ || Growth Opportunities Matrix~ | Growth Strategy and Implementation~ || Growth Strategies for Your Company~ || Prioritized Opportunities through Implementation~ || Legal Disclaimer~ | Appendix~ || Abbreviations and Acronyms Used~ || Other Companies~ || List of Exhibits~ |
| List of Charts and Figures | 1. Total DR Market: Classification of DR, Asia-Pacific, 2017~ 2. Total DR Market: Factors Leading to DR, Asia-Pacific, 2017~ 3. Total DR Market: Key Market Drivers and Restraints, Global, 2018–2025~ 4. Total DR Market: Revenue Flow Chart, Asia-Pacific, 2017~ 5. Total DR Market: Competitive Landscape of Service Providers, Asia-Pacific, 2017~ 6. Total DR Market: Competitive Landscape of Software Solution, Asia-Pacific, 2017~ 7. Total DR Market: Competitor Capability Matrix, Asia-Pacific, 2017~ 8. Total DR Market: Electricity Value Chain, Asia-Pacific, 2017~ 9. Total DR Market: Stakeholder Roles in the DR Aggregator Model, Asia-Pacific, 2017~ 10. Total DR Market: DR Aggregator Business Model—Regional Highlights, Global, 2017~| 1. Total DR Market: Revenue Forecast, Asia-Pacific, 2017–2025~ 2. Total DR Market: Percent Revenue Forecast by Region, Asia-pacific, 2017–2025~ 3. Total Demand Response Market: Key Market Drivers & Restraints, Asia-Pacific, 2018–2025~ 4. Total DR Market: Percent Revenue Split by End Users, Asia-Pacific, 2017~ 5. Total DR Market: Percent Revenue Split by End Users, Asia-Pacific, 2017~ 6. Total Demand Response Market: Overall DR Attractiveness* by Country, Asia-Pacific, 2017~ 7. Total DR Market: Revenue Forecast, Asia-Pacific, 2016–2025~ 8. Total DR Market: Revenue Forecast by Region, Asia-Pacific, 2016–2025~ |
| Author | Avanthika Satheesh |
| Industries | Energy |
| WIP Number | P9DA-01-00-00-00 |
| Keyword 1 | Demand Response |
| Is Prebook | No |
| GPS Codes | 9301-A4,9597,9852,9B07-C1 |