 USD
USD GBP
GBP CNY
CNY EUR
EUR INR
INR JPY
JPY MYR
MYR ZAR
ZAR KRW
KRW THB
THBStrategic Analysis of the Global Artificial Lifts Market
Strategic Analysis of the Global Artificial Lifts Market
Aging Conventional Wells and Faster Production Decline from Unconventional Fields are Major Drivers
03-Nov-2015
Global
$4,950.00
Special Price $3,712.50 save 25 %
Description
This research service provides a strategic analysis of the global artificial lifts market, segmented by technology including rod lifts, gas lifts, electric submersible pumps, progressive pump cavity lifts, plunger lifts, and hydraulic pumping systems. It provides forecasts, and discusses the market drivers and restraints for each segment. It also covers technological advancements and selection criteria for various artificial lifts and includes a competitive analysis of market participants. The study also covers an in-depth regional analysis with potential growth opportunities for North America, Latin America, Europe, the Middle East and Africa, and Asia-Pacific. The base year is 2014, with the forecast period running from 2015 to 2021.
RESEARCH: INFOGRAPHIC
This infographic presents a brief overview of the research, and highlights the key topics discussed in it.Click image to view it in full size
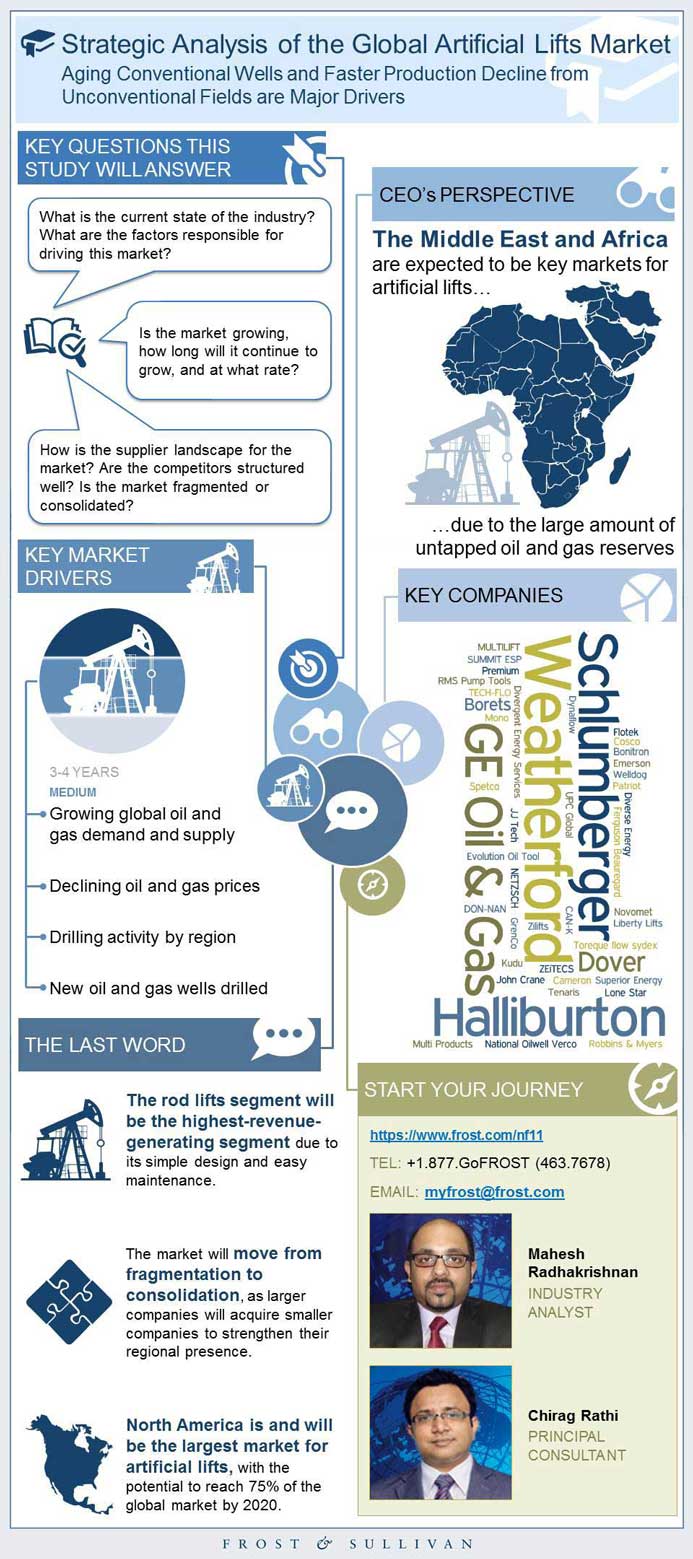
Table of Contents
Key Findings
Market Engineering Measurements, Global, 2014
- Market Overview
- Competitor Overview
- Total Addressable Market
CEO’s Perspective
Definitions
Market Segmentation
Key Market Drivers, Global, 2015–2021
Key Market Restraints, Global, 2015–2021
Market Measurements, Global, 2014
Revenue Forecast, Global, 2011–2021
World Rig Count, Global, 2011–2020
Percent Revenue Forecast by Region, Global, 2011–2021
Revenue Forecast, Global, 2011–2021
Market Share
Market Share Evolution
Market Share Analysis
Competitive Structure, Global, 2014
Key Findings
Market Engineering Measurements, Global, 2014
Revenue Forecast, Global, 2011–2021
Key Findings
Market Engineering Measurements, Global, 2014
Revenue Forecast, Global, 2011–2021
Key Findings
Market Engineering Measurements, Global, 2014
Revenue Forecast, Global, 2011–2021
Estimated Well Count, Global, 2014
Key Findings
Market Engineering Measurements, Global, 2014
Revenue Forecast, Global, 2011–2021
Key Findings
Market Engineering Measurements, Global, 2014
Revenue Forecast, Global, 2011–2021
Key Findings
Market Engineering Measurements, Global, 2014
Revenue Forecast, Global, 2011–2021
Key Findings
Market Engineering Measurements, Global, 2014
Revenue Forecast, Global, 2011–2021
Oil & Gas Outlook
Rotary Rig Count, North America, 2014
Revenue Forecast, North America, 2011–2021
Europe and CIS Key Findings
Oil & Gas Outlook
Revenue Forecast, Europe, 2011–2021
Asia-Pacific Breakdown
Oil & Gas Outlook
Regional Outlook
Revenue Forecast, Asia-Pacific, 2011–2021
Latin America Breakdown
Oil & Gas Outlook
Regional Outlook
Revenue Forecast, Latin America, 2011–2021
Key Findings
Oil & Gas Outlook
Africa’s Offshore—The Second Wave of Global Oil Supply Response
Revenue Forecast, MEA, 2011–2021
3 Big Predictions
Legal Disclaimer
Market Methodology
List of Companies in “Others”
Abbreviations and Acronyms Used
- 1. Primary Advantages and Shortcomings of Artificial Lift Technologies
- 2. Total Artificial Lifts Market: Key Market Drivers, Global, 2015–2021
- 3. Total Artificial Lift Market: Key Market Restraints, Global, 2015–2021
- 4. Total Artificial Lifts Market: Cost Comparison between Plunger Lifts and Rod Lifts, Global, 2014
- 5. Total Artificial Lifts Market: Market Engineering Measurements, Global, 2014
- 6. Total Artificial Lifts Market: Revenue Forecast by Region, Global, 2011–2021
- 7. Total Artificial Lifts Market: Company Market Share Analysis of Top 6 Participants, Global, 2014
- 8. Total Artificial Lifts Market: Competitive Structure, Global, 2014
- 9. Electrical Submersible Pumps Segment: Market Engineering Measurements, Global, 2014
- 10. Rod Lift Segment: Market Engineering Measurements, Global, 2014
- 11. Progressive Cavity Pumps Segment: Market Engineering Measurements, Global, 2014
- 12. PCP Systems Segment: Estimated Well Count, Global, 2014
- 13. Hydraulic Pumping Systems Segment: Market Engineering Measurements, Global, 2014
- 14. Gas Lifts Segment: Market Engineering Measurements, Global, 2014
- 15. Plunger Lifts Segment: Market Engineering Measurements, Global, 2014
- 16. Other Lifts Segment: Market Engineering Measurements, Global, 2014
- 17. Percent Growth in Real GDP: North America, 2013–2015
- 18. Artificial Lifts Market: Rotary Rig Count, North America, 2014
- 19. Percent Growth in Real GDP: Europe & CIS, 2013–2015
- 20. Percent Growth in Real GDP: Asia-Pacific, 2013–2015
- 21. Percent Growth in Real GDP: Latin America, 2014–2016
- 22. Percent Growth in Real GDP: MEA, 2013–2015
- 23. Artificial Lifts Market: Oil Exploration Mapping, Africa, 2014
- 1. Total Artificial Lifts Market: Market Engineering Measurements, Global, 2014
- 2. Total Artificial Lifts Market: Percent Revenue Breakdown, Global, 2014
- 3. Total Artificial Lifts Market: Oil Demand and Supply, Global, 2013–2030
- 4. Total Artificial Lifts Market: Gas Demand and Supply, Global, 2013–2030
- 5. Total Artificial Lifts Market: Benchmark Crude Oil Price, Global, 2000–2015
- 6. Total Artificial Lifts Market: World Rotary Rig Count, Global, 2010–2015
- 7. Total Artificial Lifts Market: New Wells Drilled, Global, 2010–2020
- 8. Total Artificial Lifts Market: Revenue Forecast, Global, 2011–2021
- 9. Total Artificial Lifts Market: World Rig Count, Global, 2011–2020
- 10. Total Artificial Lifts Market: Percent Revenue Forecast by Region, Global, 2011–2021
- 11. Total Artificial Lifts Market: Revenue Forecast by Product Type Market, Global, 2011–2021
- 12. Total Artificial Lifts Market: Percent Revenue Breakdown, Global, 2014
- 13. Total Artificial Lifts Market: Absolute Market Share Trend, Global, 2014 and 2021
- 14. Total Artificial Lifts Market: Percent Market Share Trend, Global, 2014 and 2021
- 15. Electrical Submersible Pumps Segment: Revenue Forecast, Global, 2011–2021
- 16. Rod Lift Segment: Revenue Forecast, Global, 2011–2021
- 17. Progressive Cavity Pumps Segment: Revenue Forecast, Global, 2011–2021
- 18. Hydraulic Pumping Systems Segment: Revenue Forecast, Global, 2011–2021
- 19. Gas Lifts Segment: Revenue Forecast, Global, 2011–2021
- 20. Plunger Lifts Segment: Revenue Forecast, Global, 2011–2021
- 21. Other Lifts Segment: Revenue Forecast, Global, 2011–2021
- 22. Total Artificial Lifts Market: Percent Revenue Breakdown, Global, 2014
- 23. Artificial Lifts Market: Revenue Forecast, North America, 2011–2021
- 24. Total Artificial Lifts Market: Percent Revenue Breakdown, Global, 2014
- 25. Artificial Lifts Market: Revenue Forecast, Europe, 2011–2021
- 26. Total Artificial Lifts Market, Percent Revenue Breakdown, Global, 2014
- 27. Artificial Lifts Market: Revenue Forecast, Asia-Pacific, 2011–2021
- 28. Total Artificial Lifts Market: Percent Revenue Breakdown, Global, 2014
- 29. Artificial Lifts Market: Revenue Forecast, Latin America, 2011–2021
- 30. Total Artificial Lifts Market: Percent Revenue Breakdown, Global, 2014
- 31. Artificial Lifts Market: Revenue Forecast, MEA, 2011–2021
- 32. Artificial Lifts Market: Crude Oil Production, MEA, 2009–2040
Popular Topics
| No Index | No |
|---|---|
| Podcast | No |
| Table of Contents | | Executive Summary~ || Key Findings~ || Market Engineering Measurements, Global, 2014~ ||| Market Overview~ ||| Competitor Overview~ ||| Total Addressable Market~ || CEO’s Perspective~ | Market Overview~ || Definitions~ ||| Types of Artificial Lifts~ |||| Rod Lift~ |||| Electric Submersible Pump (ESP)~ |||| Gas Lifts~ |||| Hydraulic Pumping System (HPS)~ |||| Plunger Lif~ |||| Progressive Cavity Pump (PCP)~ ||| Need for Artificial Lifts—Unleashing Oil Field Productivity~ |||| Issues in Oil Recovery~ |||| Key Companies~ ||||| Borets~ ||||| Dover~ ||||| Schlumberger~ ||||| Weatherford~ ||||| GE Oil & Gas ~ ||||| Others~ ||| Primary Advantages and Shortcomings of Artificial Lift Technologies~ || Market Segmentation~ ||| Percent Revenue Breakdown, Global, 2014~ | Drivers and Restraints—Total Artificial Lifts Market~ || Key Market Drivers, Global, 2015–2021 ~ ||| Growing global oil and gas demand and supply~ |||| Oil Demand and Supply, Global, 2013–2030~ |||| Gas Demand and Supply, Global, 2013–2030~ ||| Declining oil and gas prices~ |||| Benchmark Crude Oil Price, Global, 2000–2015~ ||| Drilling activity by region~ |||| World Rotary Rig Count, Global, 2010–2015~ ||| New oil and gas wells drilled~ |||| New Wells Drilled, Global, 2010–2020~ || Key Market Restraints, Global, 2015–2021~ ||| High cost of artificial lift equipment~ |||| Cost Comparison between Plunger Lifts and Rod Lifts, Global, 2014~ ||| Lack of skilled workers~ | Forecasts and Trends—Total Artificial Lifts Market~ || Market Measurements, Global, 2014~ || Revenue Forecast, Global, 2011–2021~ || World Rig Count, Global, 2011–2020~ || Percent Revenue Forecast by Region, Global, 2011–2021~ || Revenue Forecast, Global, 2011–2021~ ||| By Region~ ||| By Product Type Market ~ | Market Share and Competitive Analysis— Total Artificial Lifts Market~ || Market Share~ ||| Percent Revenue Breakdown, Global, 2014~ || Market Share Evolution~ ||| Absolute Market Share Trend, Global, 2014 and 2021~ ||| Percent Market Share Trend, Global, 2014 and 2021~ || Market Share Analysis~ ||| Weatherford~ ||| Halliburton (Baker Hughes)~ ||| Schlumberger~ ||| GE Oil & Gas~ ||| Dover Corporation~ ||| Borets Co. LLC~ ||| Others~ || Competitive Structure, Global, 2014~ | Electrical Submersible Pumps Segment Analysis~ || Key Findings~ || Market Engineering Measurements, Global, 2014~ || Revenue Forecast, Global, 2011–2021~ | Rod Lifts Segment Analysis~ || Key Findings~ || Market Engineering Measurements, Global, 2014~ || Revenue Forecast, Global, 2011–2021~ | Progressive Cavity Pumps Segment Analysis~ || Key Findings~ || Market Engineering Measurements, Global, 2014~ || Revenue Forecast, Global, 2011–2021~ || Estimated Well Count, Global, 2014~ | Hydraulic Pumping Systems Segment Analysis~ || Key Findings~ || Market Engineering Measurements, Global, 2014~ || Revenue Forecast, Global, 2011–2021~ | Gas Lifts Segment Analysis~ || Key Findings~ || Market Engineering Measurements, Global, 2014~ || Revenue Forecast, Global, 2011–2021~ | Plunger Lifts Segment Analysis~ || Key Findings~ || Market Engineering Measurements, Global, 2014~ || Revenue Forecast, Global, 2011–2021~ | Other Lifts Segment Analysis~ || Key Findings~ || Market Engineering Measurements, Global, 2014~ || Revenue Forecast, Global, 2011–2021~ | North America Analysis~ ||| North America Breakdown~ ||| Percent Growth in Real GDP: North America, 2013–2015 ~ ||| Percent Revenue Breakdown, Global, 2014~ || Oil & Gas Outlook~ || Rotary Rig Count, North America, 2014~ || Revenue Forecast, North America, 2011–2021~ | Europe Analysis~ || Europe and CIS Key Findings~ ||| Percent Growth in Real GDP: Europe & CIS, 2013–2015 ~ ||| Percent Revenue Breakdown, Global, 2014~ || Oil & Gas Outlook~ || Revenue Forecast, Europe, 2011–2021~ | Asia-Pacific Analysis~ || Asia-Pacific Breakdown ~ ||| Percent Growth in Real GDP: Asia-Pacific, 2013–2015~ ||| Percent Revenue Breakdown, Global, 2014~ || Oil & Gas Outlook~ || Regional Outlook~ || Revenue Forecast, Asia-Pacific, 2011–2021~ | Latin America Analysis~ || Latin America Breakdown~ ||| Percent Growth in Real GDP: Latin America, 2014–2016~ ||| Percent Revenue Breakdown, Global, 2014~ || Oil & Gas Outlook~ || Regional Outlook~ || Revenue Forecast, Latin America, 2011–2021~ | The Middle East and Africa (MEA) Analysis~ || Key Findings~ ||| Percent Growth in Real GDP: MEA, 2013–2015~ ||| Percent Revenue Breakdown, Global, 2014~ || Oil & Gas Outlook~ || Africa’s Offshore—The Second Wave of Global Oil Supply Response~ ||| Oil Exploration Mapping, Africa, 2014~ || Revenue Forecast, MEA, 2011–2021~ ||| Crude Oil Production, MEA, 2009–2040~ | The Last Word~ || 3 Big Predictions~ || Legal Disclaimer~ | Appendix~ || Market Methodology~ || List of Companies in “Others”~ || Abbreviations and Acronyms Used~ |
| List of Charts and Figures | 1. Primary Advantages and Shortcomings of Artificial Lift Technologies~ 2. Total Artificial Lifts Market: Key Market Drivers, Global, 2015–2021~ 3. Total Artificial Lift Market: Key Market Restraints, Global, 2015–2021~ 4. Total Artificial Lifts Market: Cost Comparison between Plunger Lifts and Rod Lifts, Global, 2014~ 5. Total Artificial Lifts Market: Market Engineering Measurements, Global, 2014~ 6. Total Artificial Lifts Market: Revenue Forecast by Region, Global, 2011–2021~ 7. Total Artificial Lifts Market: Company Market Share Analysis of Top 6 Participants, Global, 2014~ 8. Total Artificial Lifts Market: Competitive Structure, Global, 2014~ 9. Electrical Submersible Pumps Segment: Market Engineering Measurements, Global, 2014~ 10. Rod Lift Segment: Market Engineering Measurements, Global, 2014~ 11. Progressive Cavity Pumps Segment: Market Engineering Measurements, Global, 2014~ 12. PCP Systems Segment: Estimated Well Count, Global, 2014~ 13. Hydraulic Pumping Systems Segment: Market Engineering Measurements, Global, 2014~ 14. Gas Lifts Segment: Market Engineering Measurements, Global, 2014~ 15. Plunger Lifts Segment: Market Engineering Measurements, Global, 2014~ 16. Other Lifts Segment: Market Engineering Measurements, Global, 2014 ~ 17. Percent Growth in Real GDP: North America, 2013–2015 ~ 18. Artificial Lifts Market: Rotary Rig Count, North America, 2014 ~ 19. Percent Growth in Real GDP: Europe & CIS, 2013–2015 ~ 20. Percent Growth in Real GDP: Asia-Pacific, 2013–2015 ~ 21. Percent Growth in Real GDP: Latin America, 2014–2016 ~ 22. Percent Growth in Real GDP: MEA, 2013–2015 ~ 23. Artificial Lifts Market: Oil Exploration Mapping, Africa, 2014~| 1. Total Artificial Lifts Market: Market Engineering Measurements, Global, 2014~ 2. Total Artificial Lifts Market: Percent Revenue Breakdown, Global, 2014~ 3. Total Artificial Lifts Market: Oil Demand and Supply, Global, 2013–2030~ 4. Total Artificial Lifts Market: Gas Demand and Supply, Global, 2013–2030~ 5. Total Artificial Lifts Market: Benchmark Crude Oil Price, Global, 2000–2015~ 6. Total Artificial Lifts Market: World Rotary Rig Count, Global, 2010–2015~ 7. Total Artificial Lifts Market: New Wells Drilled, Global, 2010–2020~ 8. Total Artificial Lifts Market: Revenue Forecast, Global, 2011–2021~ 9. Total Artificial Lifts Market: World Rig Count, Global, 2011–2020~ 10. Total Artificial Lifts Market: Percent Revenue Forecast by Region, Global, 2011–2021~ 11. Total Artificial Lifts Market: Revenue Forecast by Product Type Market, Global, 2011–2021 ~ 12. Total Artificial Lifts Market: Percent Revenue Breakdown, Global, 2014~ 13. Total Artificial Lifts Market: Absolute Market Share Trend, Global, 2014 and 2021~ 14. Total Artificial Lifts Market: Percent Market Share Trend, Global, 2014 and 2021~ 15. Electrical Submersible Pumps Segment: Revenue Forecast, Global, 2011–2021~ 16. Rod Lift Segment: Revenue Forecast, Global, 2011–2021~ 17. Progressive Cavity Pumps Segment: Revenue Forecast, Global, 2011–2021~ 18. Hydraulic Pumping Systems Segment: Revenue Forecast, Global, 2011–2021~ 19. Gas Lifts Segment: Revenue Forecast, Global, 2011–2021~ 20. Plunger Lifts Segment: Revenue Forecast, Global, 2011–2021~ 21. Other Lifts Segment: Revenue Forecast, Global, 2011–2021~ 22. Total Artificial Lifts Market: Percent Revenue Breakdown, Global, 2014~ 23. Artificial Lifts Market: Revenue Forecast, North America, 2011–2021~ 24. Total Artificial Lifts Market: Percent Revenue Breakdown, Global, 2014~ 25. Artificial Lifts Market: Revenue Forecast, Europe, 2011–2021~ 26. Total Artificial Lifts Market, Percent Revenue Breakdown, Global, 2014~ 27. Artificial Lifts Market: Revenue Forecast, Asia-Pacific, 2011–2021~ 28. Total Artificial Lifts Market: Percent Revenue Breakdown, Global, 2014~ 29. Artificial Lifts Market: Revenue Forecast, Latin America, 2011–2021~ 30. Total Artificial Lifts Market: Percent Revenue Breakdown, Global, 2014~ 31. Artificial Lifts Market: Revenue Forecast, MEA, 2011–2021~ 32. Artificial Lifts Market: Crude Oil Production, MEA, 2009–2040~ |
| Author | Mahesh Radhakrishnan |
| Industries | Energy |
| WIP Number | NF11-01-00-00-00 |
| Is Prebook | No |