Ethiopian Pharmaceutical Market, Forecast to 2020
Preference for Generic Prescription Drugs to Create New Market Dynamics, Demand for Anti-Infectives Rises
29-Jan-2016
Africa
Market Research
$4,950.00
Special Price $3,712.50 save 25 %
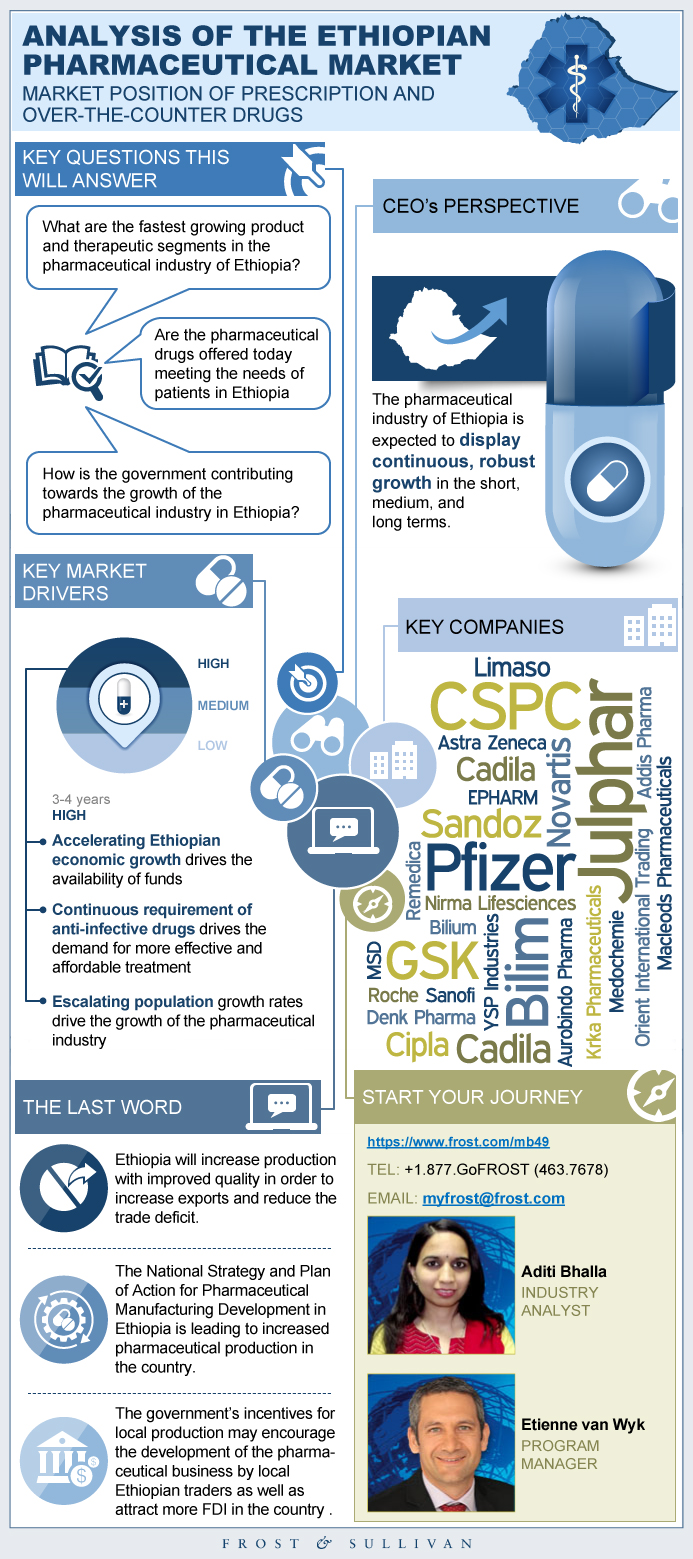
This study offers an insight into the pharmaceutical industry of Ethiopia, where preference for generic, prescription drugs is growing. There is information on recent reforms introduced by the government (like tax benefits for in-country production, national strategy, and plan of action for pharmaceutical manufacturing development, growth and transformation plan, and so on), key participants in the market, population and disease statistics, and so on. The study also describes the opportunities and constraints in the market and revenue forecasts for the total market from 2011–2020. Primary research interviews with industry stakeholders and secondary research through in-house Frost & Sullivan database and news reports were undertaken.
Key Findings
Scope and Segmentation
- Geographic coverage
- Study period
- Base year
- Forecast period
- Monetary unit
- Conversion rate
Market Engineering Measurements
- Market Stage
- Market Revenue
- Compound Annual Growth Rate
- Customer Price Sensitivity
- Degree of Technical Change
- Number of Competitors
CEO’s Perspective
Key Companies to Watch
3 Big Predictions
Ethiopia
Infrastructure and Economic Situation
Healthcare Industry
Healthcare Infrastructure
Disease Profile
Healthcare Financing Indicators
Pharmaceutical Market—Background
Process of Procurement and Distribution
Essential Requirements for Drug Registration
- Structure of Public Healthcare in Ethiopia
- Per cent of Healthcare Facilities, Ethiopia, 2012
- Total Number of Hospitals by Region, Ethiopia, 2012
Total Pharmaceutical Market—Segmentation
Increase in Generic Drugs’ Market Share
Per cent Sales Breakdown by Therapeutic Segment, Ethiopia, 2014
New Market Opportunities
Total Pharmaceutical Market: Game-changing Strategies, Ethiopia, 2014
Merger, Acquisition, and Partnership Assessment
Key Market Drivers, Ethiopia, 2015-2020
Key Market Restraints, Ethiopia, 2015–2020
Definitions
Revenue Forecast by Market Size
Per Cent Revenue Forecast by Non-prescription, Generic, and Branded Drugs
Key Therapeutic Segment Growth Analysis, Ethiopia, 2014–2020
Growth Forecast by Key Therapeutic Segments, Ethiopia, 2014
Total Pharmaceutical Market: PESTLE Analysis, Ethiopia, 2014
Market Share—Prescription Drugs and Non-prescription Drugs
Market Share—Prescription Drugs and Non-prescription Drugs
Branded Drugs Segment: Per cent Revenue Breakdown, Ethiopia, 2014
Companies to Watch
Legal Disclaimer
List of Companies in “Others”
Market Engineering Methodology
- 1. Disease Indicators, Ethiopia, 2011 and 2013
- 2. Total Pharmaceutical Market: Key Market Drivers, Ethiopia, 2015-2020
- 3. Total Pharmaceutical Market: Key Market Restraints, Ethiopia, 2015–2020
- 4. Total Pharmaceutical Market: Market Engineering Measurements, Ethiopia, 2014
- 5. Total Pharmaceutical Market: Growth Forecast by Key Therapeutic Segments, Ethiopia, 2014
- 1. Total Pharmaceutical Market: Market Engineering Measurements, Ethiopia, 2014
- 2. Population Split by Gender, Ethiopia, 2014
- 3. Inflation at Consumer Prices, Ethiopia, 2010–2014 Annual Infrastructural Improvements, Ethiopia, 2011–2015
- 4. Per cent of Healthcare Facilities, Ethiopia, 2012
- 5. Total Number of Hospitals by Region, Ethiopia, 2012
- 6. Healthcare Expenditures, Ethiopia, 2010–2013
- 7. Healthcare Expenditures, Ethiopia, 2010–2013
- 8. Total Pharmaceutical Market: Procurement Process, Ethiopia, 2014
- 9. Total Pharmaceutical Market: Per cent Sales Breakdown by Therapeutic Segment, Ethiopia, 2014
- 10. Total Pharmaceutical Market: Revenue Forecast, Ethiopia, 2011–2020
- 11. Total Pharmaceutical Market: Per cent Revenue Forecast by Non-prescription, Generic and Branded Drugs, Ethiopia, 2011–2020
- 12. Total Pharmaceutical Market: Key Therapeutic Segment Growth Analysis, Ethiopia, 2014–2020
- 13. Total Pharmaceutical Market: Per cent Revenue Breakdown, Ethiopia, 2014
- 14. Generic Drugs Segment: Per cent Revenue Breakdown, Ethiopia, 2014
- 15. Branded Drugs Segment: Per cent Revenue Breakdown, Ethiopia, 2014
- 16. GDP Per Capita, Ethiopia, 2010–2014
- 17. Health Financing Sources, Ethiopia, 2013
Purchase includes:
- Report download
- Growth Dialog™ with our experts
Growth Dialog™
A tailored session with you where we identify the:- Strategic Imperatives
- Growth Opportunities
- Best Practices
- Companies to Action
Impacting your company's future growth potential.
| Deliverable Type | Market Research |
|---|---|
| No Index | No |
| Podcast | No |
| Table of Contents | | Executive Summary~ || Key Findings~ || Scope and Segmentation~ ||| Geographic coverage~ ||| Study period~ ||| Base year~ ||| Forecast period~ ||| Monetary unit~ ||| Conversion rate~ || Market Engineering Measurements~ ||| Market Stage~ ||| Market Revenue~ ||| Compound Annual Growth Rate~ ||| Customer Price Sensitivity~ ||| Degree of Technical Change ~ ||| Number of Competitors~ || CEO’s Perspective~ || Key Companies to Watch~ || 3 Big Predictions~ | Market Overview~ || Ethiopia~ || Infrastructure and Economic Situation~ || Healthcare Industry~ || Healthcare Infrastructure~ ||| Structure of Public Healthcare in Ethiopia~ ||| Per cent of Healthcare Facilities, Ethiopia, 2012~ ||| Total Number of Hospitals by Region, Ethiopia, 2012~ || Disease Profile~ || Healthcare Financing Indicators~ || Pharmaceutical Market—Background~ || Process of Procurement and Distribution~ || Essential Requirements for Drug Registration~ || Total Pharmaceutical Market—Segmentation~ || Increase in Generic Drugs’ Market Share~ || Per cent Sales Breakdown by Therapeutic Segment, Ethiopia, 2014~ | Competitive Playbook~ || New Market Opportunities~ || Total Pharmaceutical Market: Game-changing Strategies, Ethiopia, 2014~ || Merger, Acquisition, and Partnership Assessment~ | Drivers and Restraints~ || Key Market Drivers, Ethiopia, 2015-2020~ ||| Accelerating Ethiopian economic growth~ ||| Continuous requirement of anti-infective drugs~ ||| Escalating population~ ||| Increasing incidences of non-communicable diseases~ ||| Extension of healthcare coverage and improvements in infrastructure~ || Key Market Restraints, Ethiopia, 2015–2020~ ||| Shortage of FOREX with the National Bank~ ||| Deficiency of resources in medical institutions hampers the quality of workforce~ ||| Lengthy regulatory policies for the pharmaceutical industry~ | Forecast and Trends~ || Definitions~ || Revenue Forecast by Market Size~ ||| Revenue Forecast, Ethiopia, 2011–2020~ || Per Cent Revenue Forecast by Non-prescription, Generic, and Branded Drugs~ || Key Therapeutic Segment Growth Analysis, Ethiopia, 2014–2020~ || Growth Forecast by Key Therapeutic Segments, Ethiopia, 2014~ || Total Pharmaceutical Market: PESTLE Analysis, Ethiopia, 2014~ | Competitive Environment~ || Market Share—Prescription Drugs and Non-prescription Drugs~ || Market Share—Prescription Drugs and Non-prescription Drugs~ || Branded Drugs Segment: Per cent Revenue Breakdown, Ethiopia, 2014~ | Key Companies to Watch~ || Companies to Watch~ ||| Addis Pharmaceutical Factory PLC~ ||| Aurobindo Pharma Limited~ ||| Cadila Pharmaceutical~ ||| GlaxoSmithKline~ ||| Julphar~ ||| Novartis~ | The Last Word~ || Legal Disclaimer~ | Appendix~ || List of Companies in “Others”~ ||| Aurobindo Pharma ~ ||| GSK ~ ||| EPHARM ~ ||| Bilium ~ ||| Denk Pharma ~ || Market Engineering Methodology~ |
| List of Charts and Figures | 1. Disease Indicators, Ethiopia, 2011 and 2013~ 2. Total Pharmaceutical Market: Key Market Drivers, Ethiopia, 2015-2020~ 3. Total Pharmaceutical Market: Key Market Restraints, Ethiopia, 2015–2020~ 4. Total Pharmaceutical Market: Market Engineering Measurements, Ethiopia, 2014~ 5. Total Pharmaceutical Market: Growth Forecast by Key Therapeutic Segments, Ethiopia, 2014~| 1. Total Pharmaceutical Market: Market Engineering Measurements, Ethiopia, 2014~ 2. Population Split by Gender, Ethiopia, 2014~ 3. Inflation at Consumer Prices, Ethiopia, 2010–2014 Annual Infrastructural Improvements, Ethiopia, 2011–2015~ 4. Per cent of Healthcare Facilities, Ethiopia, 2012~ 5. Total Number of Hospitals by Region, Ethiopia, 2012~ 6. Healthcare Expenditures, Ethiopia, 2010–2013~ 7. Healthcare Expenditures, Ethiopia, 2010–2013~ 8. Total Pharmaceutical Market: Procurement Process, Ethiopia, 2014~ 9. Total Pharmaceutical Market: Per cent Sales Breakdown by Therapeutic Segment, Ethiopia, 2014~ 10. Total Pharmaceutical Market: Revenue Forecast, Ethiopia, 2011–2020~ 11. Total Pharmaceutical Market: Per cent Revenue Forecast by Non-prescription, Generic and Branded Drugs, Ethiopia, 2011–2020~ 12. Total Pharmaceutical Market: Key Therapeutic Segment Growth Analysis, Ethiopia, 2014–2020~ 13. Total Pharmaceutical Market: Per cent Revenue Breakdown, Ethiopia, 2014~ 14. Generic Drugs Segment: Per cent Revenue Breakdown, Ethiopia, 2014~ 15. Branded Drugs Segment: Per cent Revenue Breakdown, Ethiopia, 2014~ 16. GDP Per Capita, Ethiopia, 2010–2014~ 17. Health Financing Sources, Ethiopia, 2013~ |
| Lightbox Content | World Cancer Day 2019|Get 15% discount for all Healthcare studies |https://store.frost.com/contacts/?utm_source=PD&utm_medium=lightbox&utm_campaign=HEALTHCARE_CANCER2019 |
| Author | Aditi Bhalla |
| Industries | Healthcare |
| WIP Number | MB49-01-00-00-00 |
| Is Prebook | No |


